
An in-depth analysis of Polygon’s MATIC performance, growth in holders, and the bearish trends affecting its price.
Points
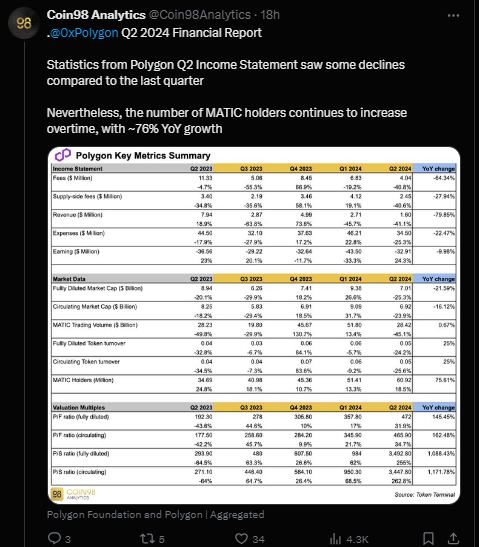
- MATIC holders increased by 76% year-on-year.
- Despite growth in holders, MATIC faces bearish trends on technical charts.
- Key support and resistance levels are crucial for future price movements.
In the second quarter of 2024, Polygon’s MATIC holders on the Polygon chain increased by an impressive 76% year-on-year, resulting in the addition of 28 million new independent addresses. According to a report by Coin98 Analytics, despite some fluctuation in financial data month-on-month, the overall network indicators showed significant growth compared to the same period last year.
MATIC Facing Weakness on Technical Chart
On the daily technical chart, Polygon (MATIC) has been in bearish territory for an extended period. Its price was halted at $1.2888 and has since been in a downtrend. MATIC is trading below the key exponential moving averages of the 50-Day and 200-Day, showcasing bearish momentum.
The Relative Strength Index (RSI) and Moving Average Convergence Divergence (MACD) indicators are also indicating bearish signals as both are trading in bearish territory.
At the time of writing, Polygon’s price was trading at $0.5036 with a minor intraday gain of 0.32%. Currently, its market cap stands at $4,938,270,886, and its 24-hour trading volume is $284,316,898.
Polygon Weak Performance
Polygon (MATIC) has shown disappointing performance this year, with a negative return of 48.63% year-to-date. Over the last 6 months, it has decreased by approximately 44.54%, and in the last month, it saw a negative return of 23.24%. According to the technical summary on TradingView, out of 26 indicators, 14 are on the sell side, 10 are neutral, and 2 are on the buy side, demonstrating a bearish trend.
Conclusion
While Polygon’s MATIC has experienced a significant increase in holders and transaction volume, indicating a growing interest in its ecosystem, the cryptocurrency is currently facing bearish trends on the technical chart. Despite the network’s expansion and the addition of new NFTs, MATIC’s price performance has been underwhelming, with a notable year-to-date decline. The technical indicators suggest continued bearish momentum, which may lead to further price decreases if the current support level is broken.
解説
- Market Expansion: The increase in MATIC holders highlights the growing interest and adoption of the Polygon network, despite the bearish price trends.
- Technical Analysis: Understanding key technical indicators like RSI, MACD, and moving averages is crucial for predicting future price movements and making informed trading decisions.
- Future Outlook: Maintaining key support levels is essential for reversing the bearish trend and achieving potential price recoveries.