
An updated analysis of Shiba Inu (SHIB) price trends, market conditions, and potential price movements for July 9.
Points
- SHIB’s price remains stable over the last 24 hours.
- Technical analysis shows a bearish trend with low chances of significant price movement.
- Price consolidation is likely until SHIB can break key resistance levels.
- Midterm view suggests sideways trading within a specific price range.
The Shiba Inu (SHIB) cryptocurrency has seen its price remain stable over the last 24 hours, with no significant changes in value. This stability, however, does not indicate a strong bullish or bearish trend but suggests that the market is in a wait-and-see mode.
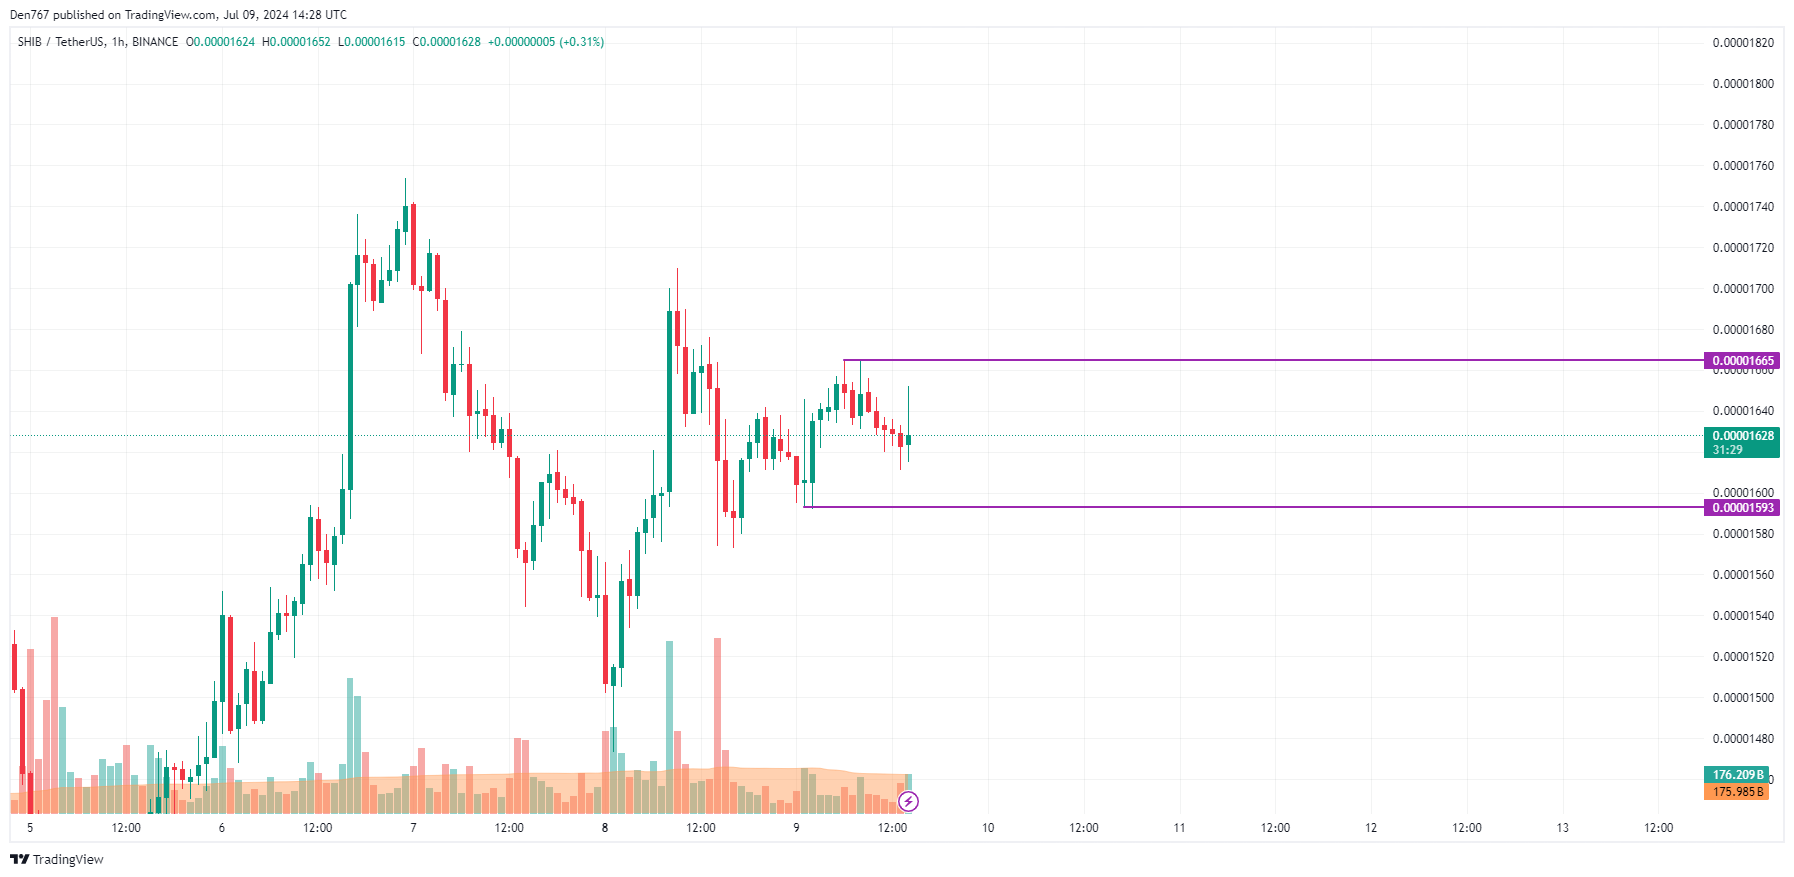
SHIB/USD
On the hourly chart, SHIB’s price is positioned in the middle of a local channel. Given that most of the daily Average True Range (ATR) has been exhausted, there is little expectation for any sharp price movements before the end of the day.
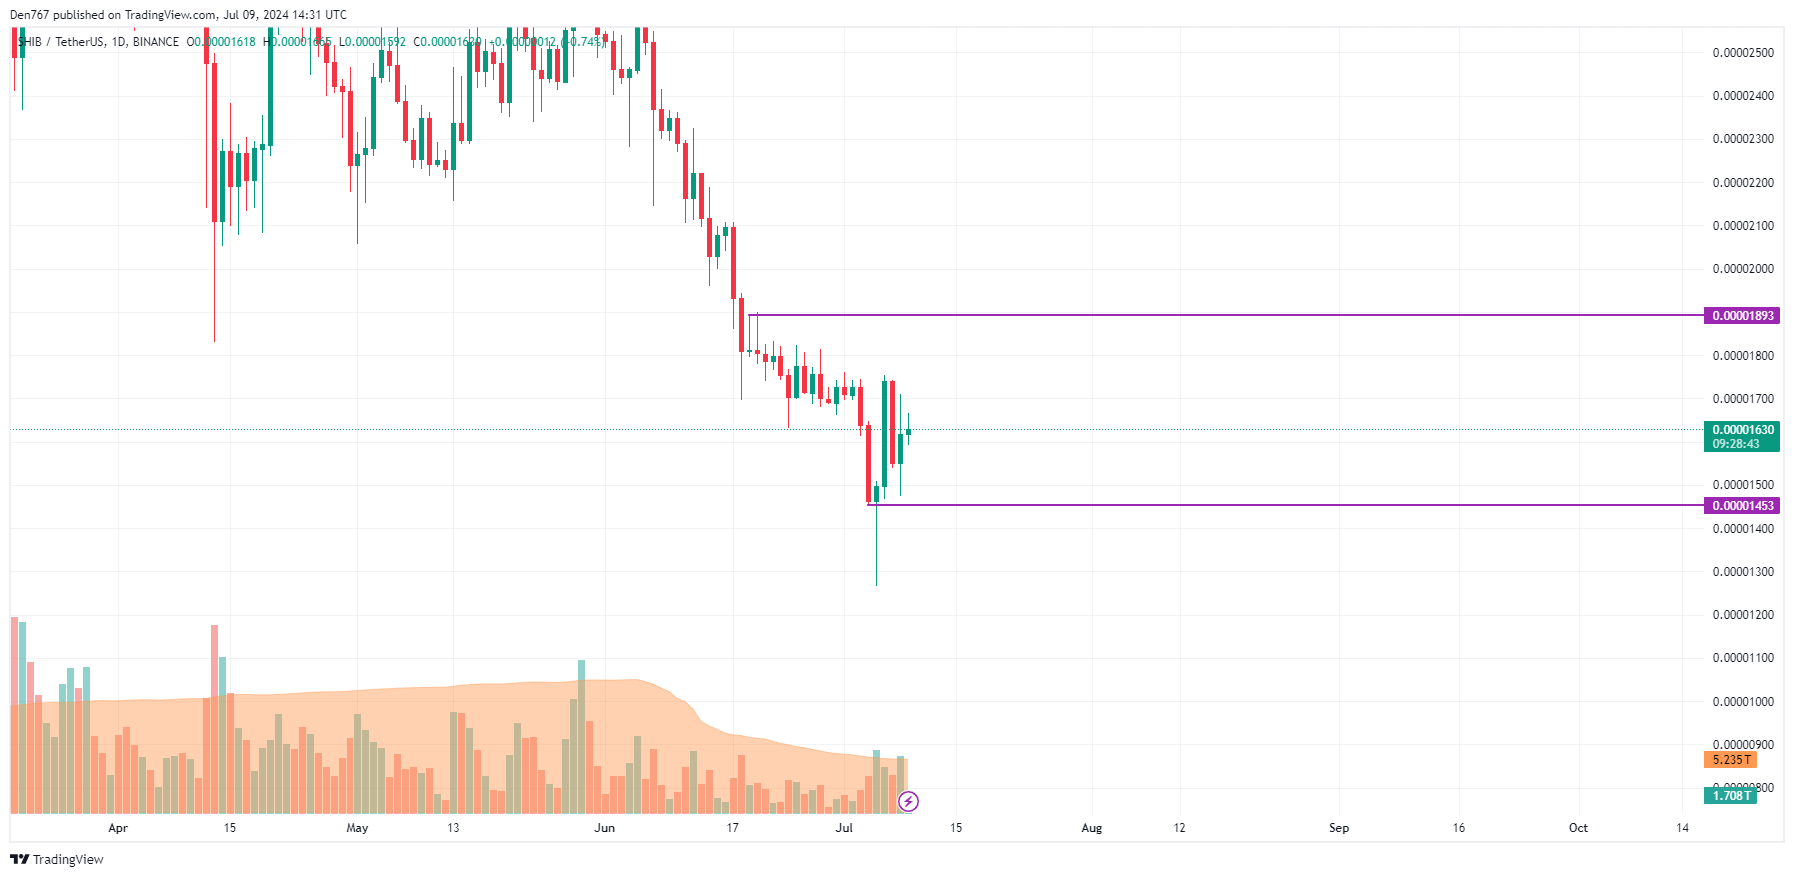
Bigger Time Frame Analysis
Looking at the daily time frame, the situation appears bearish. The price of SHIB is closer to its support level than to its resistance. For a potential reversal, buyers need to push the price back to the $0.000018 zone and sustain it above this level.
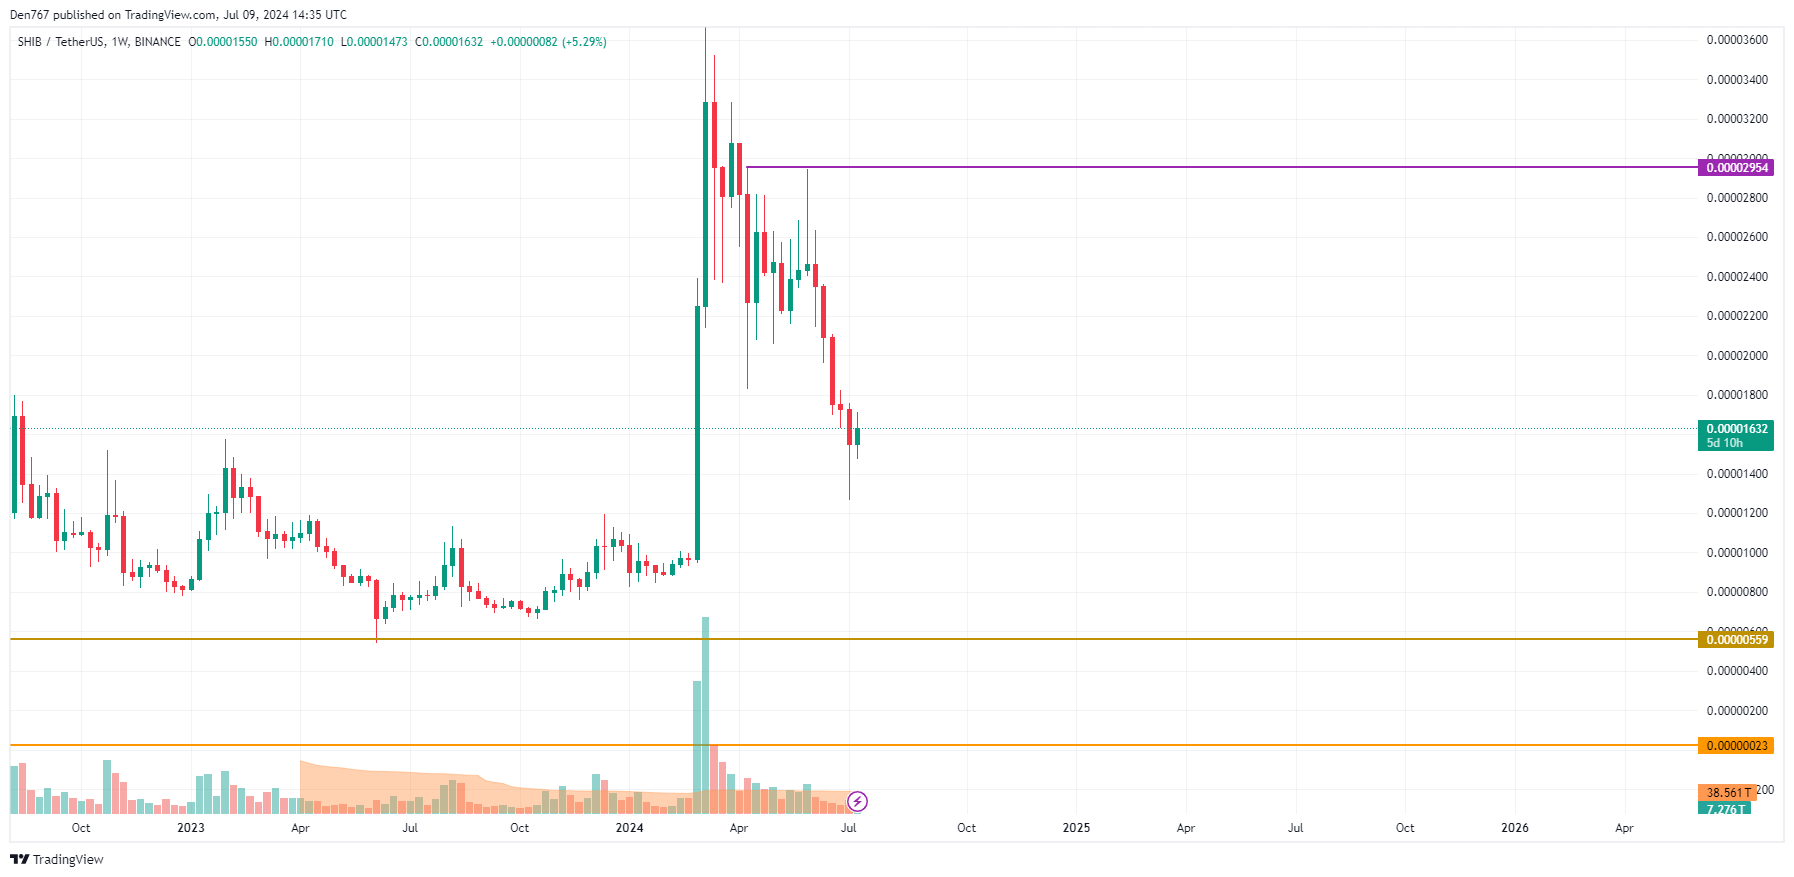
Midterm Outlook
From a midterm perspective, the SHIB market shows no clear dominance by either buyers or sellers. The price is currently trading within the previous bar’s range. If this pattern continues, sideways trading between $0.000015 and $0.000018 is the most likely scenario.
Conclusion
The current market sentiment for SHIB is neutral to bearish, with no immediate signs of significant movement. Investors and traders should watch for a breakout above $0.000018 to signal a potential bullish trend. Until then, SHIB is expected to trade sideways within the established price range.
解説
- Market Sentiment: The current market sentiment for SHIB is neutral to bearish, with stable prices indicating a wait-and-see approach among investors.
- Technical Analysis: Key technical indicators suggest limited movement, with the price consolidating within a defined range. Breaking the $0.000018 resistance is crucial for a bullish trend.
- Investor Strategy: Investors should monitor key resistance and support levels and be prepared for potential sideways trading in the short to midterm.