
Solana-based memecoin POPCAT achieves significant growth, hitting the $1 mark amid a 360% surge, but historical patterns suggest a potential correction due to overbought conditions.
Points
- POPCAT surges 360%, reaching the $1 mark.
- Significant interest and trading volume increase.
- Historical patterns indicate a potential correction.
- Bollinger Bands and RSI suggest overbought conditions.
Solana-based memecoin POPCAT has seen remarkable growth, surging by 360% in the last 30 days and hitting the key $1 mark. This impressive rally has attracted significant interest from mainstream traders, leading to a notable increase in trading volume and social dominance.
Surge in Social Value and Market Dominance
POPCAT’s surge in value is closely tied to increased social media attention and trading activity. Santiment, a crypto intelligence platform, highlighted that such sudden spikes in interest and value often precede corrections. This pattern suggests that while the current surge attracts traders, better entry points may emerge after a potential correction.
https://twitter.com/santimentfeed/status/1814925242252599499
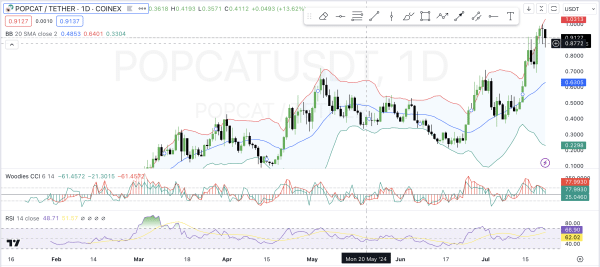
Analyzing POPCAT’s daily chart reveals critical insights into its current market position. The Bollinger Bands indicate high volatility, with the price nearing the upper band, suggesting an overbought condition. The 20-period Simple Moving Average (SMA) acts as mid-line support, with the price significantly above this level, reflecting strong upward momentum.
The Relative Strength Index (RSI), currently at 66.75, supports these observations. It indicates strong momentum without being overbought, suggesting that while there is room for further price increases, a correction may still occur.
The correlation between volume spikes and price increases suggests strong buying interest driving the current market trend. However, increased volume often precedes higher volatility, indicating the potential for a bearish phase. At press time, POPCAT trades 7.16% down in the last 24 hours at $0.8233, reflecting the initial stages of a potential correction.
###解説
- The 360% surge in POPCAT’s value highlights the memecoin’s ability to attract significant attention and trading volume, driven by social media and market sentiment.
- Technical indicators such as Bollinger Bands and RSI suggest that POPCAT is in overbought territory, indicating a high likelihood of a price correction.
- Historical patterns of sudden interest and value spikes often leading to corrections underscore the importance of cautious trading and strategic entry points.
- The potential correction presents opportunities for investors to buy at lower prices, capitalizing on the expected volatility and subsequent recovery.
- Monitoring technical indicators and market trends is crucial for investors to make informed decisions and mitigate risks associated with rapid price movements in the memecoin market.