
This article provides a detailed price prediction for Avalanche (AVAX) from 2024 to 2030, analyzing technical indicators and market dynamics to help investors make informed decisions.
Points
- AVAX is predicted to reach a high of $34.38 by the end of 2024.
- The price range for 2025 is projected between $42.66 and $52.85.
- By 2030, AVAX could reach a high of $335.76, with an average price of $294.81.
Avalanche (AVAX) has exhibited wild price swings in 2024, reflecting the overall volatility in the crypto market. This article explores the potential future trajectory of AVAX, offering a detailed price prediction from 2024 to 2030 based on technical analysis and market dynamics.
Overview
– Cryptocurrency: Avalanche
– Ticker: AVAX
– Current Price: $28.30
– Market Cap: $11,242,961,281
– Trading Volume: $379,496,928
– Circulating Supply: 394,809,373
– All-Time Low: $2.79 (Dec 31, 2020)
– All-Time High: $146.22 (Nov 21, 2021)
– 24-Hour High: $28.32
– 24-Hour Low: $26.35
Avalanche Price Prediction: Technical Analysis
Metric | Value
– – | —
Volatility (30-day variation) | 6.38%
50-day SMA | $28.63
200-day SMA | $37.58
Sentiment | Bearish
Fear and Greed Index | 68 (Greed)
Green days | 14⁄30 (47%)
Avalanche Price Analysis: AVAX Registers Little Momentum
Key takeaways:
– Unlike most mega-altcoins, AVAX’s drop from the annual high was not sharp.
– The direction of the coming breakout is not evident.
AVAX/USD 1-day chart price analysis
The1-daychartforAVAXshowsthatunlikemostmega-altcoins,itsdropfromtheannualhighwasnotdrastic.Inmid-June,itrecoveredto$0.8599beforeresumingthebearishrun.TheWilliamAlligatortrendlinesnowshowitisinconsolidation,andtheMACDshowsithasregisteredlittlemomentumoverthelastfourdays.TheRSIisinneutralterritory.Historically,longperiodsofconsolidationhaveresultedinextendedbreakouts,butthedirectionofthecomingbreakoutisnotevident.
AVAX/USD4-hourchartpriceanalysis
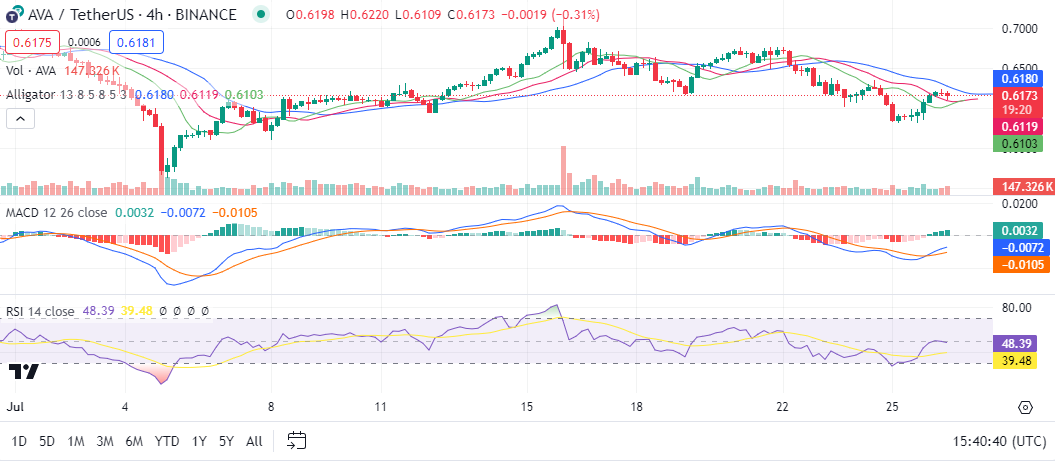
The 4-hour chart highlights AVAX’s bullish run this month. The run gradually rose from a low of $0.5128 to $0.7125. The William Alligator was asleep for the rest of the period, meaning its volatility was low. Currently, it registers positive momentum as it rose from a recent low; it also raises chances of rising higher in the short term.
AVAX Technical Analysis: Levels and Action
Daily Simple Moving Average (SMA)
Period | Value ($) | Action
– – | — | —
SMA 3 | 28.24 | SELL
SMA 5 | 28.81 | SELL
SMA 10 | 28.84 | SELL
SMA 21 | 27.79 | BUY
SMA 50 | 28.63 | SELL
SMA 100 | 32.68 | SELL
SMA 200 | 37.58 | SELL
Daily Exponential Moving Average (EMA)
Period | Value ($) | Action
– – | — | —
EMA 3 | 27.81 | BUY
EMA 5 | 27.39 |