
A popular crypto analyst has forecasted a potential 20,080% increase in JasmyCoin’s price, projecting a rise to $4.47842. The prediction is based on technical indicators, including Fibonacci retracement, RSI, and Elliott Wave analysis, suggesting a bullish breakout.
Points
- An analyst predicts a 20,080% surge for JasmyCoin, aiming for $4.47842.
- Technical indicators show neutral to bullish signals amidst recent consolidation.
- Fibonacci retracement and Elliott Wave analysis support a bullish outlook.
- The crypto community is closely watching for a potential breakout.
- JasmyCoin has been in a consolidation phase after a significant decline in 2021.
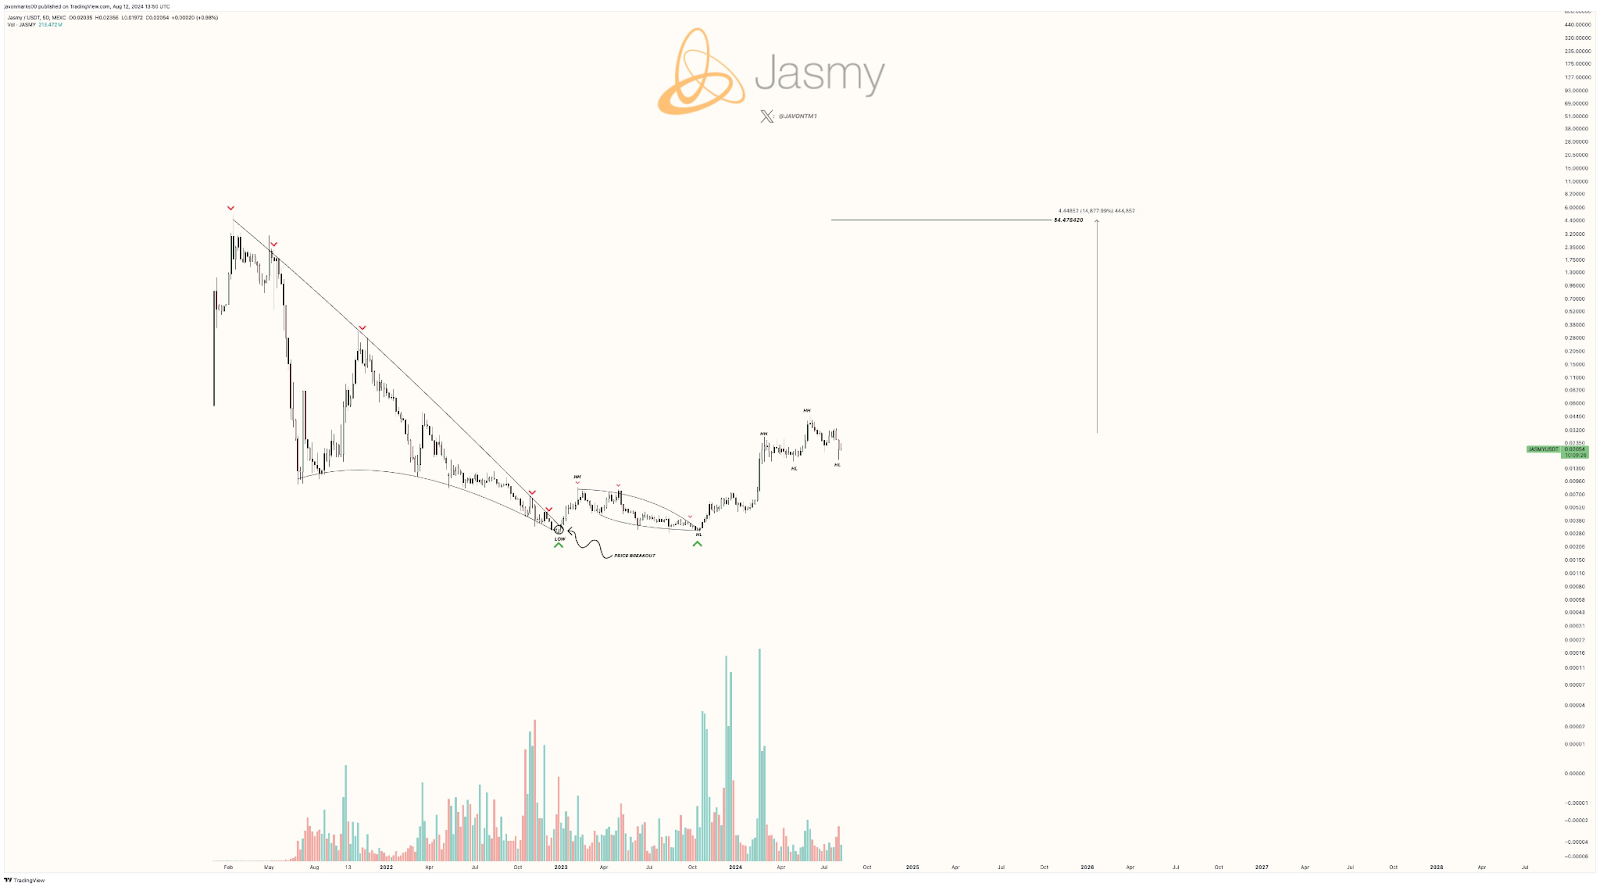
JasmyCoin (JASMY) is generating considerable buzz in the crypto community, as a well-known analyst has projected a staggering 20,080% surge in its price. According to the analyst, JasmyCoin could reach a high of $4.47842, marking a dramatic increase from its current levels. This bold prediction is rooted in a detailed technical analysis of JasmyCoin’s price movement, with key indicators pointing to a potential bullish breakout.
The price chart of JasmyCoin reveals a history of volatility, characterized by a sharp decline from its peak in early 2021. Following this downturn, the coin entered a prolonged consolidation phase, with price movements largely confined within a narrow range. This consolidation period, however, has set the stage for what could be a significant upward trend.
Technical Indicators and Analysis
Fibonacci Retracement
The analysis begins with a focus on the Fibonacci retracement levels, which are widely used to identify potential support and resistance levels. The 4-hour chart of JasmyCoin, sourced from Binance, shows that after reaching a peak of $0.03351, the price retraced to a low of approximately $0.01584. During this period, the price tested various Fibonacci levels, with the current consolidation taking place around the 0.236 level, near $0.02053. This suggests a neutral market sentiment, with a potential shift in momentum as the price approaches key support and resistance zones.
RSI and MACD Indicators
Further supporting the bullish outlook are the Relative Strength Index (RSI) and Moving Average Convergence Divergence (MACD) indicators. The RSI remains in neutral territory, indicating that the market is neither overbought nor oversold. This neutral stance provides room for a potential upward move. Meanwhile, the MACD indicator shows signs of flattening, which often precedes a shift in market momentum. A bullish crossover of the MACD line over the signal line could signal the beginning of an uptrend.
Elliott Wave Analysis
The Elliott Wave theory, which analyzes market cycles through structured wave patterns, also points to a bullish scenario for JasmyCoin. The chart annotations indicate the formation of waves W, X, and Y, with the potential for a significant upward move as the next wave unfolds. The target price, marked by a horizontal line on the chart, aligns with the analyst’s projection of $4.47842. If this wave structure plays out as expected, it could lead to one of the most substantial rallies in JasmyCoin’s history.
Market Sentiment
The broader market sentiment around JasmyCoin is one of cautious optimism. While the coin has experienced significant downturns in the past, the current technical setup suggests that it may be poised for a major breakout. The projected target of $4.47842, if achieved, would represent an extraordinary return for investors, drawing attention from both retail and institutional players.
Investors and traders are closely monitoring JasmyCoin’s price movements, particularly around the key support and resistance levels identified by the Fibonacci retracement. The next few trading sessions could be crucial in determining whether the bullish breakout materializes.
解説
- Technical Analysis: The use of Fibonacci retracement and Elliott Wave theory in this analysis highlights the importance of technical indicators in forecasting price movements. These tools help traders identify potential entry and exit points, making them essential for navigating volatile markets like cryptocurrency.
- Market Psychology: The neutral RSI and flattening MACD suggest a market in a state of equilibrium, where neither bulls nor bears have a clear advantage. This setup is often a precursor to a significant move, as traders position themselves for the next trend.
- Risk and Reward: While the potential for a 20,080% surge is enticing, it’s important for investors to consider the risks involved. Cryptocurrency markets are notoriously volatile, and while technical analysis provides valuable insights, it is not infallible. Investors should approach such predictions with a balanced perspective, weighing the potential rewards against the inherent risks.