
After a period of stagnation, meme coins like Dogecoin (DOGE) and Shiba Inu (SHIB) are showing signs of a bullish revival. As Bitcoin hovers near $59K, these popular meme coins are forming patterns that could lead to significant breakout rallies in the coming weeks.
Points
- Dogecoin (DOGE) and Shiba Inu (SHIB) are preparing for potential breakout rallies.
- DOGE is forming a falling wedge pattern, indicating a possible bullish reversal.
- SHIB is consolidating and showing signs of a shift in sentiment with a potential to break key resistance levels.
- Both meme coins have been under bearish influence but are now exhibiting bullish technical indicators.
- A successful breakout could lead to substantial price increases for both DOGE and SHIB.
The meme coin market, dominated by Dogecoin (DOGE) and Shiba Inu (SHIB), appears to be gearing up for a significant resurgence. After a period of lackluster performance and bearish sentiment, both DOGE and SHIB are showing technical patterns that suggest a bullish reversal may be on the horizon.
Dogecoin’s Potential Breakout
Dogecoin, the original meme coin, has been trading under heavy bearish influence in recent months. The price has been forming a falling wedge pattern, a bullish technical indicator that often precedes a breakout. A falling wedge occurs when an asset’s price declines with converging trendlines, indicating that the selling pressure is weakening and a reversal may be imminent.
As of now, DOGE is trading at approximately $0.10460, having experienced a 12.46% jump recently. This rise was triggered by lower price rejection at the support trendline of the wedge, signaling that buyers are stepping in. The current price action suggests that DOGE could soon test the overhead resistance at $0.12 and potentially break above it.
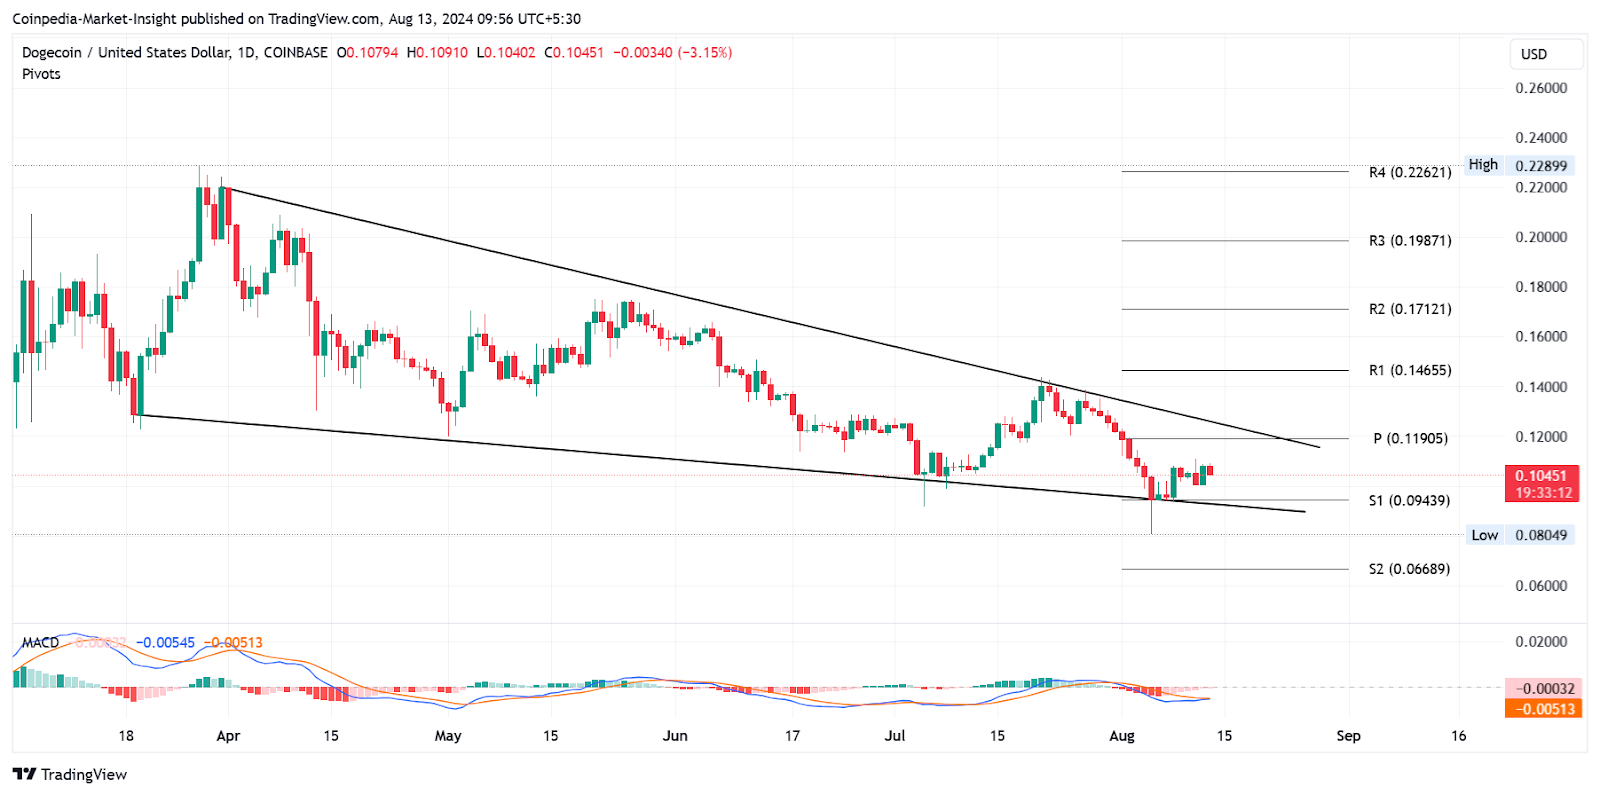
The MACD (Moving Average Convergence Divergence) indicator has also shown a bullish crossover, further supporting the possibility of an upward breakout. Should DOGE manage to overcome the resistance, the price could surge towards $0.20, representing a significant increase from its current levels.
Shiba Inu’s Path to Recovery
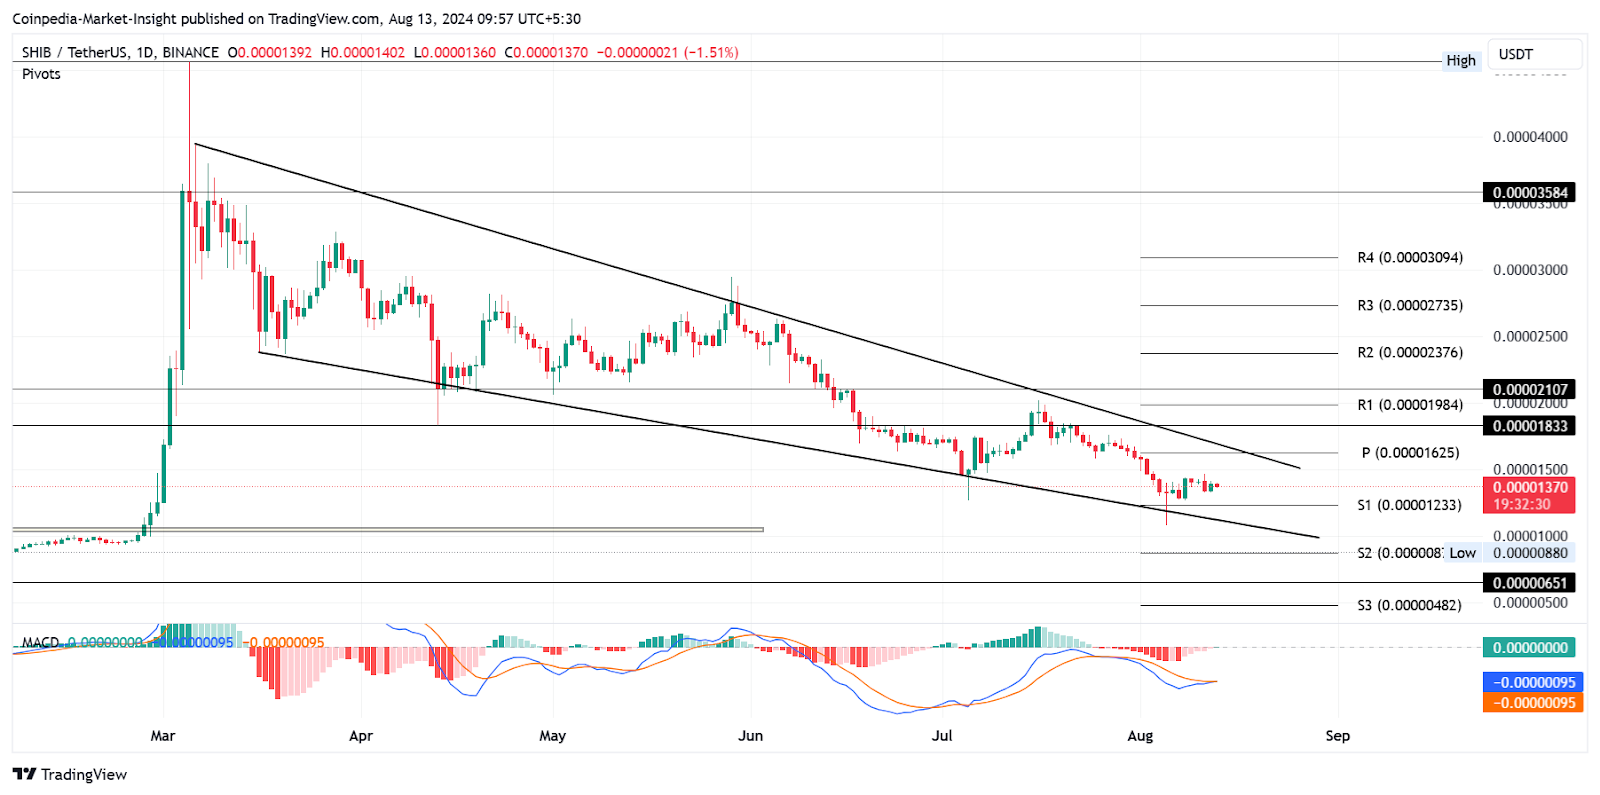
Shiba Inu, often dubbed the “Dogecoin killer,” has also been under bearish pressure, forming a similar falling wedge pattern. SHIB’s price is currently consolidating below the $0.000015 mark, struggling to gain momentum. However, there are signs that the sentiment is beginning to shift.
The MACD indicator for SHIB has also turned bullish, with the MACD line crossing above the signal line. This shift suggests that the recent consolidation could be paving the way for a breakout. If SHIB manages to break above the overhead trendline, it could rally towards the $0.000023 or $0.000030 levels.
While the broader crypto market remains volatile, the potential for a breakout in these meme coins could lead to substantial gains for investors. The market is closely watching the next moves of DOGE and SHIB, as their performance often influences other meme coins and sets the tone for market sentiment.
The Bigger Picture: Meme Coins in 2024
Meme coins have always been a unique segment of the cryptocurrency market, driven largely by community support and speculative interest rather than intrinsic value. The potential breakout of DOGE and SHIB could signal a broader resurgence in the meme coin space, drawing in new investors and reviving interest in these highly speculative assets.
However, it’s important to note that meme coins are inherently volatile and risky investments. While the potential for significant gains exists, so does the risk of substantial losses. Investors should approach meme coins with caution, keeping in mind the speculative nature of these assets.
解説
- Falling Wedge Pattern: A falling wedge pattern is a bullish technical indicator that suggests a potential reversal in price action. It occurs when an asset’s price declines with converging trendlines, indicating that the downward momentum is weakening. This pattern is often followed by a breakout to the upside, as the selling pressure eases and buyers step in.
- MACD Indicator: The Moving Average Convergence Divergence (MACD) is a popular momentum indicator that shows the relationship between two moving averages of a security’s price. A bullish crossover occurs when the MACD line crosses above the signal line, suggesting that the asset’s momentum is shifting towards an upward trend. This indicator is particularly useful in identifying potential reversals in price action.
- Meme Coin Volatility: Meme coins like DOGE and SHIB are known for their extreme volatility. While they can offer substantial returns in a short period, they also carry a high level of risk. Investors should be aware of the speculative nature of these assets and consider their risk tolerance before investing in meme coins.