
This article examines Stellar’s recent breakout and market performance, analyzing whether XLM is ready for a significant rally.
Points
- Stellar (XLM) breaks through the $0.1000 resistance level.
- Buyers’ accumulation leads to a recovery of over 25%.
- MACD indicator shows a bullish crossover.
- Social dominance of XLM increases, indicating positive sentiment.
- Key support and resistance levels to watch.
Stellar (XLM) has recently made a significant move by breaking through the $0.1000 resistance level, signaling a potential trend reversal. This breakout, combined with a notable recovery of over 25%, suggests that XLM may be ready to rally further.
Accumulation and Breakout
The recent accumulation of Stellar tokens has led to a substantial recovery, with buyers successfully surpassing the downward-sloping trendline hurdle of $0.1000. This breakout has trapped sellers and may trigger a massive upward move if the token sustains above this level.
Interestingly, the token saw a sharp spike in buying volume, with over 105% increase, leading to a retest of the 100-day EMA mark. This rise has positioned XLM for a potential breakout rally, supported by a bullish crossover on the MACD indicator.
MACD indicator saw a bullish crossover, indicating a potential breakout rally ahead.
Stellar at Press Time
At the time of writing, the XLM/BTC pair was at 0.00000172 BTC, and the market cap was $2.04 billion. Analysts remain neutral but suggest that the XLM price may extend its rally, driving further gains.
Ranked 49th in terms of market cap, Stellar has a total supply of 50 billion tokens, with 20.21 billion in circulation.
Trend Reversal and Future Potential
Over the past few weeks, Stellar has retraced its gains, displaying lower low swings. However, buyers have defied the selloff, breaching the key hurdle of $0.1000. This indicates a potential trend reversal, with the token likely to continue its upward trajectory.
The MACD indicator’s bullish crossover and the plotting of green bars on the histogram suggest a potential breakout rally. If XLM holds gains beyond the 100-day EMA mark, a significant uptick can be anticipated.
$XLM chart analysis shows promising signs of a trend reversal.
Traders’ Optimism and Social Dominance
As the token registered a breakout, its holders have shown increased interest, with a notable 12% rise in the social dominance curve. This implies that holders are actively discussing XLM, contributing to its positive market sentiment.
Additionally, development activity has risen, indicating growth prospects for the long term. Influential figures in the crypto community have expressed bullish views on Stellar, further boosting investor confidence.
In his Tweet, @Lumen said that Stellar has reached its demand zone and shared his bullish view.
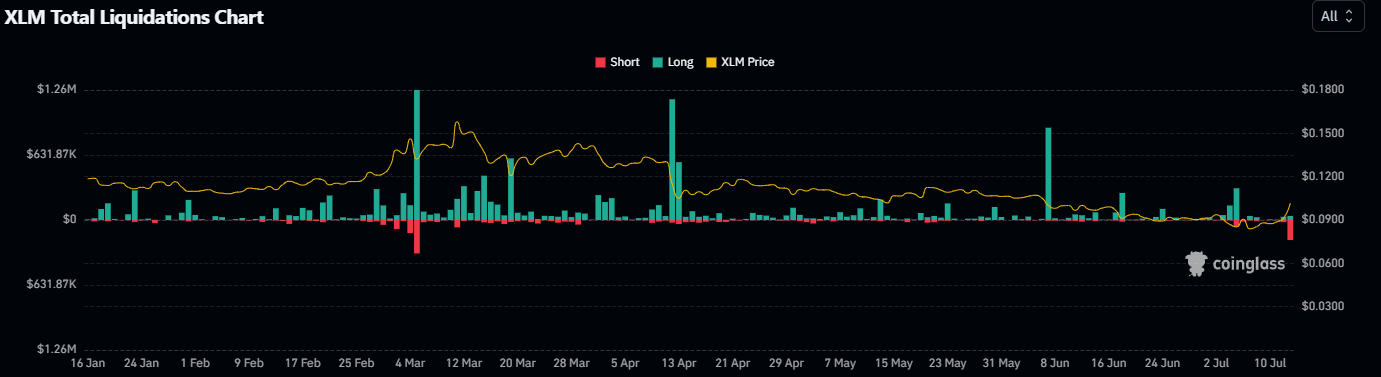
Quick Shift in Liquidations
Following the channel breakout, the seller army looked trapped and had covered their positions. At the time of writing, short liquidations noted a rise to $195k, while long liquidations stood at $39k. This liquidity data hints that traders are betting on a long position, anticipating a rise ahead.
Support and Resistance Levels
The immediate support levels for XLM are $0.0950 and $0.0900, while the key upside hurdle is around $0.1090, followed by $0.1180. If the token maintains its momentum, these levels could play a crucial role in its future price movements.
How the XLM Price May Perform
The Stellar token price has crossed the 20-day and 50-day EMA marks in a single shot and reached the 100-day EMA mark with sharp buying volume. With a breakout registered, XLM is ready to ignite an up move, potentially leading to significant gains.
解説
- Stellar’s Breakout: Stellar’s breakout above the $0.1000 mark is a key indicator of a potential trend reversal and future gains.
- Bullish Indicators: The MACD indicator’s bullish crossover and increased social dominance suggest positive market sentiment.
- Support and Resistance Levels: Key levels to watch include $0.0950 and $0.0900 (support) and $0.1090 (resistance). These levels will be critical in determining XLM’s short-term performance.