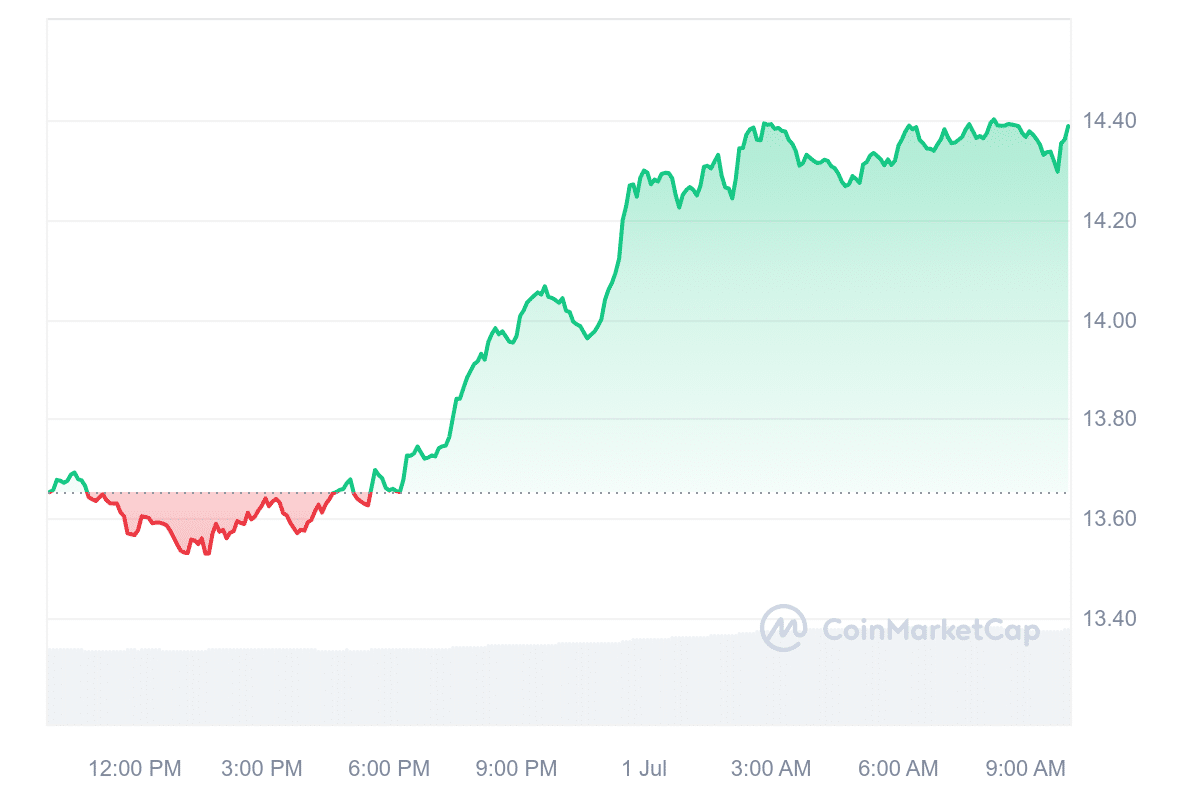
Analyzing recent whale activity and technical indicators to determine if Chainlink (LINK) is poised for a price surge.
Points
- Significant accumulation by key stakeholders with 10,000-1 million LINK coins.
- Exchange netflows for LINK have been negative, indicating accumulation.
- Technical indicators show mild bullish signals, but overall market sentiment is mixed.
- Potential for a bullish rally if LINK surpasses key EMAs.
Recent data from Santiment reveals that Chainlink’s key stakeholders, holding between 10,000 to 1 million LINK coins, have significantly increased their holdings. Since June 24th, these stakeholders have added 9.2 million LINK, a +4.65% increase in their combined holdings. This accumulation suggests strong confidence in LINK’s future potential.
Additionally, data from Into the Block shows that exchange netflows for LINK have been negative over the past two weeks, with approximately $110 million worth of LINK being withdrawn from exchanges. Typically, this behavior indicates an accumulation phase, suggesting that investors are moving LINK into long-term holdings.
On the daily technical chart, Chainlink (LINK) is finding support at $12.379. The last two trading sessions have shown mild bullishness. Despite being in a downtrend since early March, LINK’s price has increased by 6.02% in the past week, indicating buyer interest at current levels.
Technical indicators like the MACD and RSI are showing mild bullish signals. The MACD, while still in the bearish zone, has formed a bullish cross and is trending upward. The RSI has bounced back from the oversold zone and is trading above the 14-day SMA, indicating bullish momentum.
Despite these positive signs, TradingView’s technical summary shows mixed signals: out of 26 indicators, 11 suggest selling, 10 are neutral, and 5 recommend buying, indicating overall bearish sentiment.
At the time of writing, LINK is trading at $13.039, with an intraday gain of 2.35%, reflecting bullishness on the technical chart. The 24-hour trading volume is $274.24 million, and its market cap stands at $7.93 billion.

If LINK’s price can surpass and sustain above the key EMAs, it could trigger a bullish rally. However, if the price is rejected at these levels, the bearish momentum may continue.
解説
- Accumulation by Key Stakeholders: The significant accumulation of LINK by large holders indicates strong confidence in the token’s future. Such activity often precedes price increases as demand outstrips supply.
- Negative Exchange Netflows: The withdrawal of LINK from exchanges suggests that investors are moving their assets into long-term holdings, reducing the available supply on the market and potentially driving up prices.
- Technical Indicators: The MACD and RSI showing bullish signals suggest that LINK may be poised for a recovery. If these indicators continue to trend positively, it could attract more buyers and drive the price higher.
- Market Sentiment: Mixed signals from technical indicators highlight the current uncertainty in the market. Investors should closely monitor these indicators for clearer trends that could signal either a continuation of the bearish trend or a reversal into a bullish rally.
