
Solana’s short-term price action has been uncertain, with equal buying and selling pressure. This article explores the current state of SOL’s price and the factors influencing its potential rally.
Points
- Solana’s price is trading within a decisive symmetrical triangle pattern.
- The price is approaching the apex of the pattern, indicating a potential breakout.
- The 200-day moving average is expected to provide strong support.
- The RSI indicates a bullish trend, supporting the speculation of a breakout.
- Key levels to watch are $133, $140, and $150.
The short-term price action of Solana (SOL) has become increasingly uncertain as buying and selling pressures exhibit similar intensities. This has caused the price to be stuck within a crucial range, which is pivotal for its next move. While bulls are striving to lift the price above the range, they are also providing a strong base, preventing the rally from dropping below $133. Despite the ongoing price variation, SOL remains within a bullish range, maintaining hope for a positive breakout.
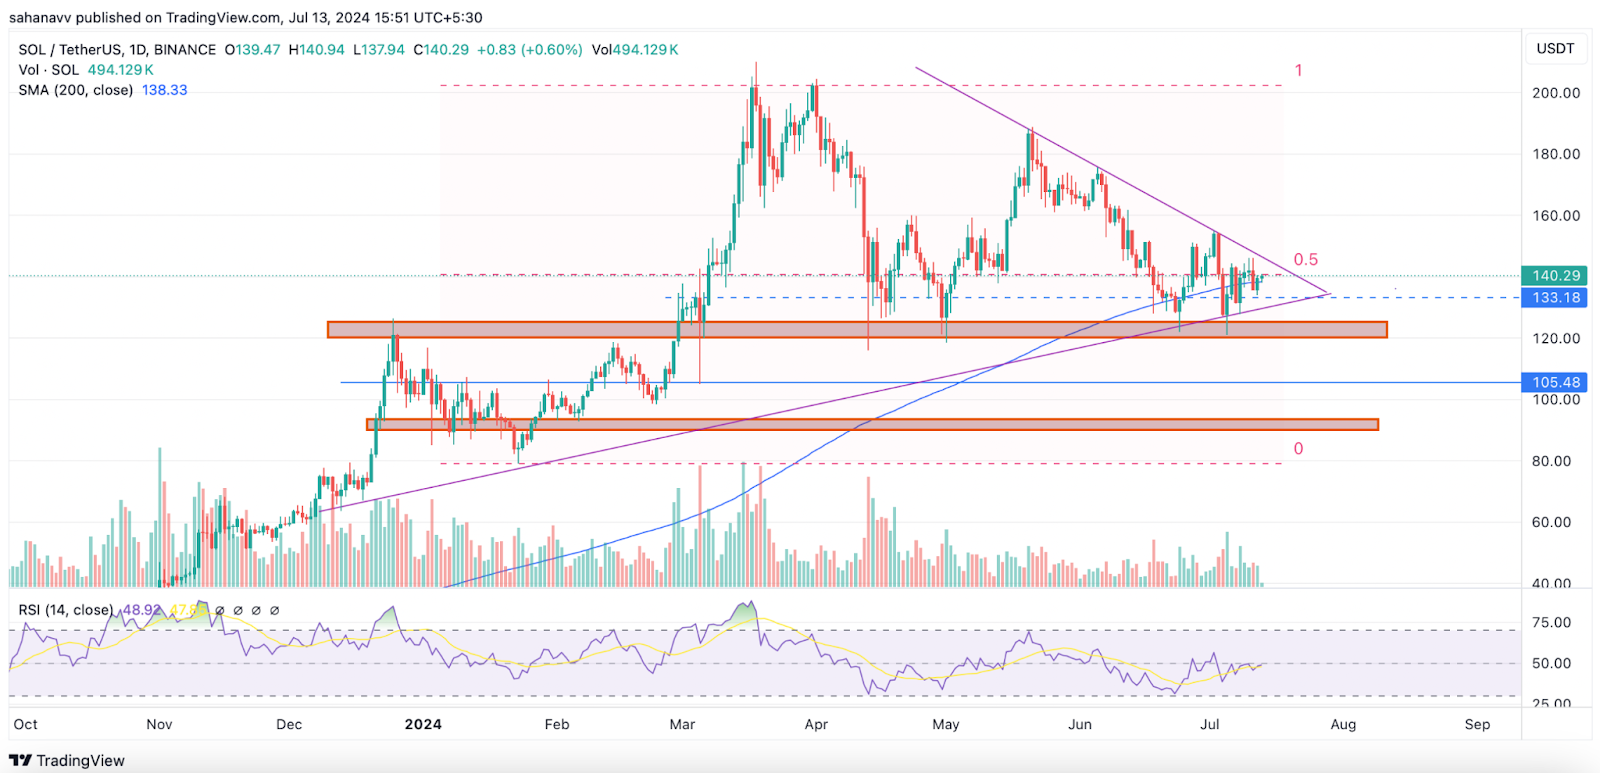
SOL is currently trading within a decisive symmetrical triangle pattern, slowly approaching the apex. The 200-day moving average (MA) is anticipated to offer strong support throughout the coming week. Consequently, the SOL price may maintain a low-volatile week and reach the apex to avoid bearish attention. The Relative Strength Index (RSI), trading along the mid-range, validates the speculation, suggesting a significant breakout influenced by volume.
Key Levels to Watch
On the technical front, the 0.5 Fibonacci (FIB) level at $140 is seen as a critical milestone. Achieving this level could elevate SOL’s price above $
”`markdown
150, further boosting bullish momentum. If the buyers gain strength, SOL could reach the 0.618 FIB level at $155. However, in the event of a bearish pullback, which currently appears unlikely, the $133 support level may offer a robust base to prevent a significant decline.
Bullish and Bearish Scenarios
In the bullish scenario, if SOL breaks above the symmetrical triangle pattern and surpasses the $140 level, it could trigger a rally towards $150 and potentially $155. This upward movement would be supported by strong buying pressure and positive market sentiment.
Conversely, in a bearish scenario, failure to break above the $140 resistance could lead to a retest of the $133 support. A breakdown below this level might result in further declines, potentially pushing SOL towards lower support zones.
Conclusion
Solana’s price action is at a critical juncture, with the symmetrical triangle pattern indicating a potential breakout. The 200-day MA and key Fibonacci levels will play crucial roles in determining the next move. Investors should closely monitor these technical indicators and market trends to make informed decisions.
解説
- Solana’s price is currently within a symmetrical triangle pattern, indicating potential for a breakout.
- The 200-day moving average and key Fibonacci levels ($140, $150, and $155) are crucial to watch.
- A bullish breakout could push SOL towards $150 and $155, while a bearish scenario might retest the $133 support.
- Investors should stay informed about technical indicators and market sentiment to navigate potential price movements.