
XRP shows strong bullish momentum, aiming to surpass key resistance levels, with technical indicators suggesting further upside potential.
Points
- XRP surges 13.29%, showing strong bullish momentum.
- Key resistance levels include $0.5286 and $0.6044.
- Technical indicators like the golden cross and Ichimoku breakout support further gains.
- Potential short-term correction indicated by RSI and MACD dynamics.
XRP, the native token of the XRP Ledger, has seen a surge in bullish sentiments, climbing 13.29% this week to test critical resistance levels. Analysts are watching closely to see if XRP can surpass key resistance at $0.5286 and potentially move towards $0.6044.
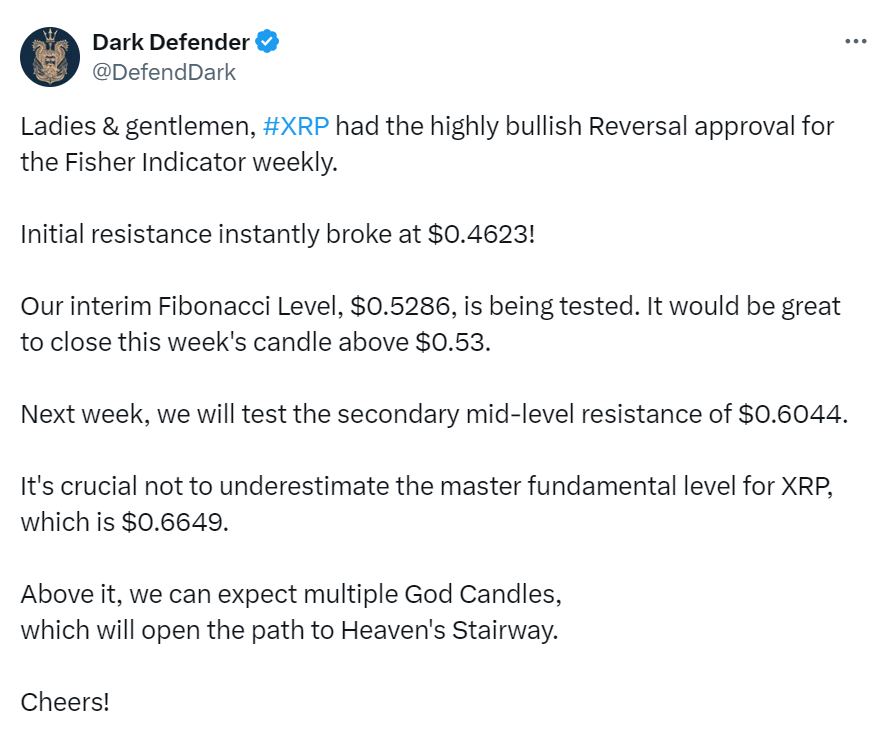
The cryptocurrency is testing a critical interim Fibonacci level at $0.5286, with hopes of closing the week above $0.53. Looking ahead, analysts anticipate a challenge at the next resistance of $0.6044 in the coming week, followed by a significant hurdle at $0.6649, a fundamental level for XRP.
Technical Indicators and Market Trends
Key technical indicators support the bullish outlook for XRP. The golden cross, a chart pattern indicating the potential for a major rally, has been observed. Additionally, the Ichimoku breakout suggests further upside potential. However, the Relative Strength Index (RSI) at 77.45 indicates that XRP is overbought, which could lead to a short-term correction.
Analyst Predictions for XRP
Analysts are optimistic about XRP’s potential to break through its resistance levels. They note that the strong bullish momentum, combined with supportive technical indicators, could drive XRP higher in the coming weeks. However, caution is advised as the RSI and MACD dynamics suggest the possibility of a short-term pullback.
解説
- Golden Cross: A bullish signal in which a short-term moving average crosses above a long-term moving average, indicating potential upward price movement.
- Ichimoku Breakout: A technical indicator that shows support and resistance levels, as well as momentum and trend direction. A breakout occurs when the price moves through these levels, suggesting a potential change in trend.
- Relative Strength Index (RSI): A momentum oscillator that measures the speed and change of price movements. An RSI above 70 indicates that a security is overbought, which can signal a potential price correction.
XRP’s recent surge underscores its strong bullish momentum and the potential for further gains if it can surpass key resistance levels. While technical indicators support this upward trend, the possibility of a short-term correction should be considered. Investors should keep a close watch on market dynamics and technical signals to make informed decisions.