 Price Prediction 2024, 2025, 2026-2030")
A comprehensive analysis of Pepe (PEPE) price predictions for 2024 through 2030, examining potential bullish and bearish trends, key technical indicators, and market comparisons.
Points
- Bullish and bearish price predictions for PEPE from 2024 to 2030.
- Key support and resistance levels for PEPE.
- Technical analysis indicators and comparison with BTC and ETH.
Pepe (PEPE) has been a standout in the memecoin market since its launch in April 2023. Known for its association with the Pepe the Frog meme, PEPE has garnered significant attention and investor interest. Here, we delve into the price predictions for PEPE from 2024 to 2030, exploring both bullish and bearish scenarios.
Pepe (PEPE) Current Market Status
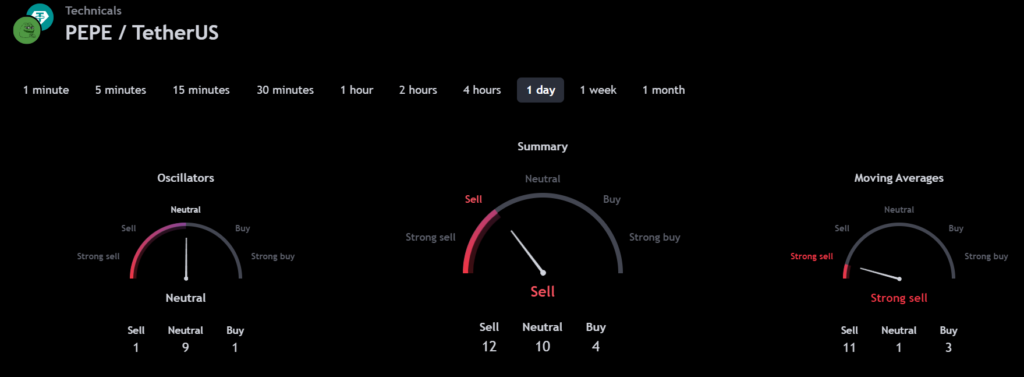
Pepe (PEPE) currently ranks 24th on CoinMarketCap in terms of market capitalization. The 24-hour trading volume and technicals indicate a mixed sentiment in the market.
What is Pepe (PEPE)?
Ticker: PEPE
Blockchain: Ethereum
Category: Memecoin
Launched On: April 2023
Utilities: Governance, security, gas fees & rewards
PEPE (PEPE) 24H Technicals
Pepe (PEPE) Price Prediction 2024
The overview of the PEPE price prediction for 2024 is shown below with a daily time frame chart indicating a W pattern, which is typically a bullish signal.
If the pattern trend continues, PEPE might reach resistance levels of $0.00000988 and $0.00001286. Conversely, if the trend reverses, the price may fall to support levels of $0.00000874 and $0.00000768.
Pepe (PEPE) Resistance and Support Levels
The chart below elucidates the possible resistance and support levels of Pepe (PEPE) in 2024.
Resistance Levels
- $0.00001073
- $0.00002300
Support Levels
- $0.00000473
- $0.00000260
Pepe (PEPE) Price Prediction 2024 — RVOL, MA, and RSI
The technical analysis indicators such as Relative Volume (RVOL), Moving Average (MA), and Relative Strength Index (RSI) are shown below.
Indicators and Inferences
Indicator: 50-Day Moving Average (50MA)
Purpose: Nature of the current trend by comparing the average price over 50 days
Reading: 50 MA = $0.00001004, Price = $0.00000885
Inference: Bearish/Downtrend
Indicator: Relative Strength Index (RSI)
Purpose: Magnitude of price change; Analyzing oversold & overbought conditions
Reading: 45.78229869
Inference: Nearly Oversold
Indicator: Relative Volume (RVOL)
Purpose: Asset’s trading volume in relation to its recent average volumes
Reading: Below cutoff line
Inference: Weak Volume
Pepe (PEPE) Price Prediction 2024 — ADX, RVI
The chart below analyzes the strength and volatility of Pepe (PEPE) using the Average Directional Index (ADX) and Relative Volatility Index (RVI).
Indicators and Inferences
Indicator: Average Directional Index (ADX)
Purpose: Strength of the trend momentum
Reading: 23.45537635
Inference: Weak Trend
Indicator: Relative Volatility Index (RVI)
Purpose: Volatility over a specific period
Reading: 40.88
Inference: Low Volatility
Comparison of PEPE with BTC, ETH
The chart below compares the price movements of Pepe (PEPE) with Bitcoin (BTC) and Ethereum (ETH).
The price action of PEPE is similar to that of BTC and ETH, indicating that when the prices of BTC and ETH increase or decrease, the price of PEPE also follows a similar trend.
Pepe (PEPE) Price Prediction 2025, 2026 – 2030
With the help of the aforementioned technical analysis indicators and trend patterns, the price predictions for Pepe (PEPE) are as follows:
Year | Bullish Price | Bearish Price
– – | — | —
2025 | $0.0002 | $0.000003
2026 | $0.0003 | $0.000002
2027 | $0.0004 | $0.000001
2028 | $0.0007 | $0.0000009
2029 | $0.002 | $0.0000008
2030 | $0.006 | $0.0000007
Conclusion
If Pepe (PEPE) establishes itself as a good investment in 2024, this year could be favorable for the cryptocurrency. The bullish price prediction for 2024 is $0.00002300, while the bearish scenario predicts $0.00000260. With positive market momentum and investor sentiment, PEPE might hit $0.0001 and possibly surpass its current all-time high (ATH) of $0.00001718.
FAQ
-
What is Pepe (PEPE)?
Pepe (PEPE) is a deflationary meme coin launched on Ethereum, building upon the legacy of Pepe the Frog. -
Where can you buy Pepe (PEPE)?
Pepe (PEPE) can be traded on exchanges like Binance, OKX, Bybit, Bitunix, and DigiFinex. -
Will Pepe (PEPE) record a new ATH soon?
With ongoing developments, PEPE has a high possibility of reaching a new ATH. -
What is the current ATH of Pepe (PEPE)?
The current ATH is $0.00001718, reached on May 27, 2024. -
What is the lowest price of Pepe (PEPE)?
The all-time low (ATL) is $0.00000002764, recorded on April 17, 2023. -
Will Pepe (PEPE) hit $0.0001?
If PEPE maintains a bullish trend, it might rally to hit $0.0001 soon. -
What will be the Pepe (PEPE) price by 2025?
PEPE might reach $0.0002 by 2025. -
What will be the Pepe (PEPE) price by 2026?
PEPE might reach $0.0003 by 2026. -
What will be the Pepe (PEPE) price by 2027?
PEPE might reach $0.0004 by 2027. -
What will be the Pepe (PEPE) price by 2028?
PEPE might reach $0.0007 by 2028.