Analyzing Solana’s recent price movements and predicting its future trends. This article provides insights into SOL’s current market position, potential support and resistance levels, and likely scenarios for its price movement.
Points
- Recent price drop of Solana (SOL) by 2%.
- Key support and resistance levels.
- Short-term and mid-term price predictions.
- Market dynamics and investor sentiment.
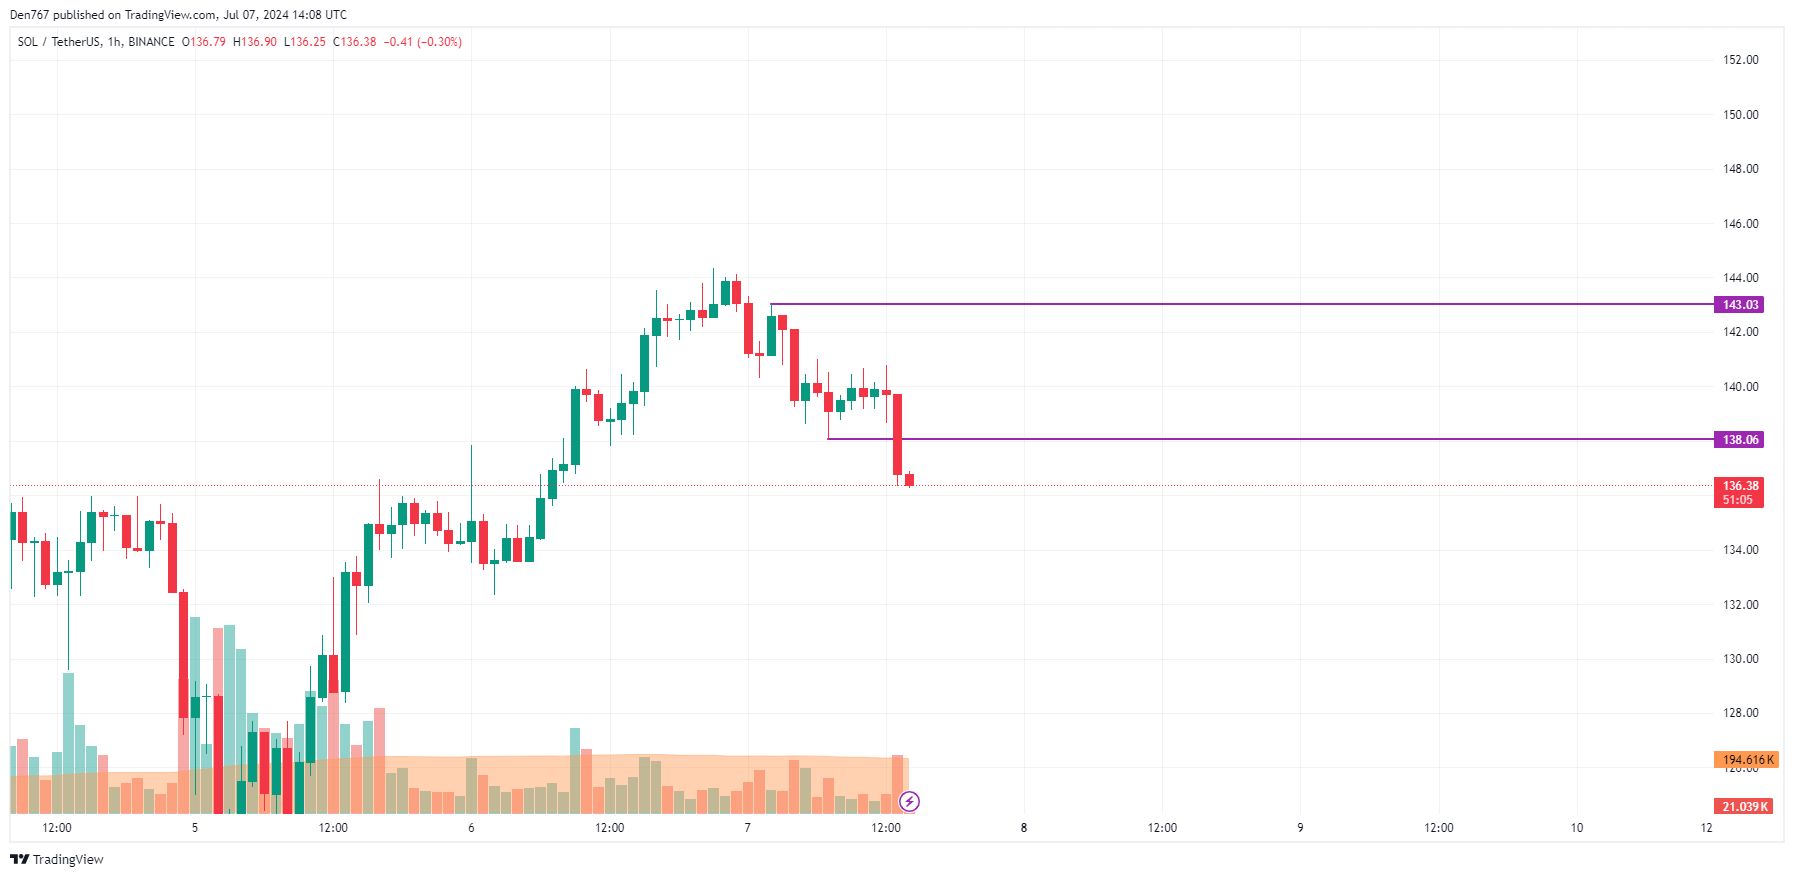
The price of Solana (SOL) has dropped by 2% over the last 24 hours. On the hourly chart, SOL has broken the local support level of $138.06. As long as the price remains below this mark, sellers appear more powerful than buyers, suggesting that the correction may continue to the $134 zone.
 Image by TradingView
Short-Term Analysis
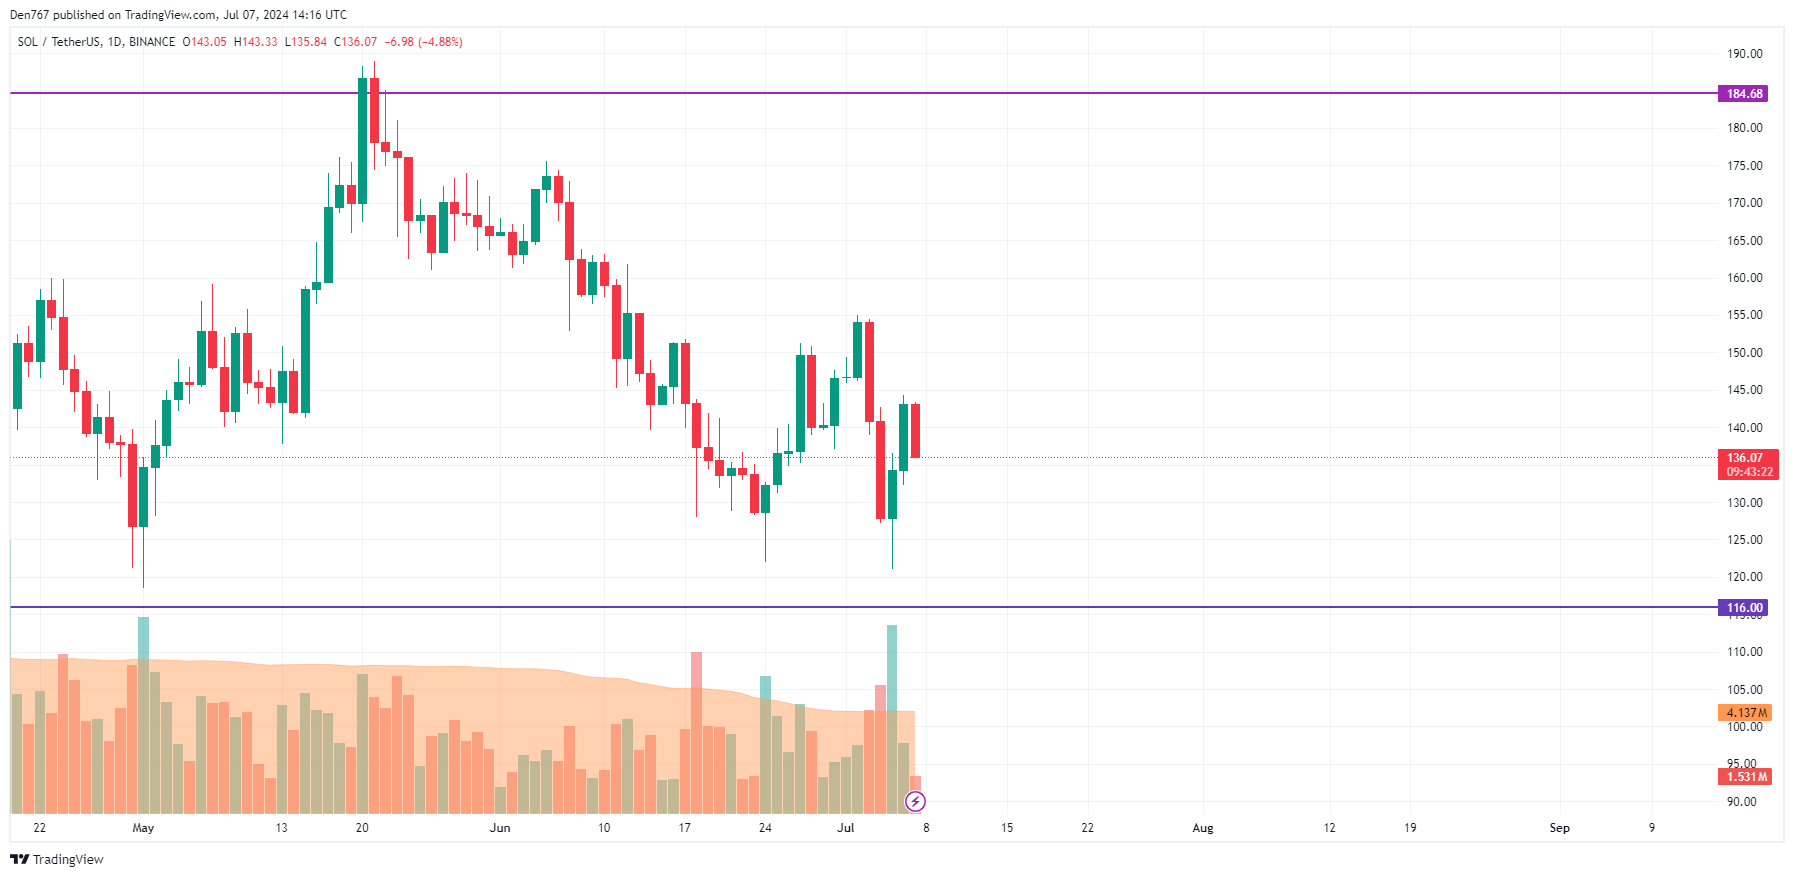
On the bigger time frame, bears could not maintain the growth after yesterday’s bullish bar closure. If the candle closes around the current prices, there is a chance of an ongoing decline to the $120 area in the upcoming week.
 Image by TradingView
Mid-Term Analysis
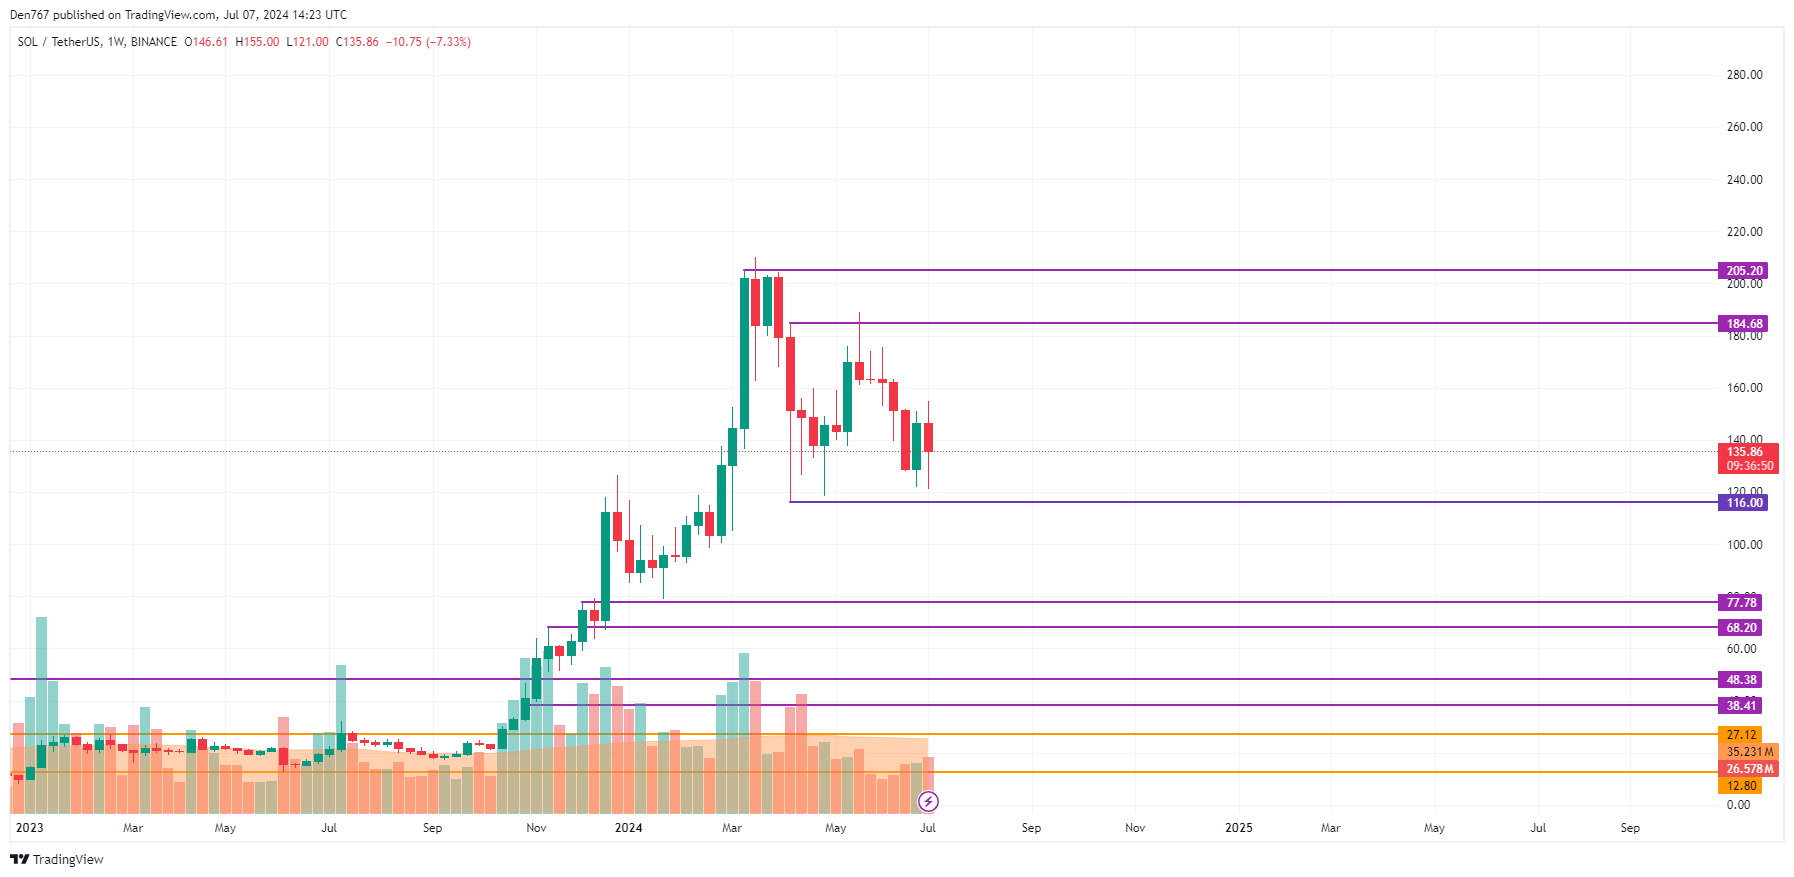
From a midterm perspective, the situation is less bearish. The rate of SOL is far from the key levels, which means neither side is dominating. Respectively, sideways trading in the wide range of $120-$150 is the more likely scenario.
 Image by TradingView
Conclusion
Solana’s recent price movements suggest a potential decline to the $120 area in the short term if current support levels fail. However, the mid-term outlook remains less bearish, with the potential for sideways trading between $120 and $150. Investors should monitor key support and resistance levels to gauge SOL’s future price movements.
解説
- Short-Term Decline: Breaking support at $138.06 suggests a potential decline to $134.
- Mid-Term Outlook: Less bearish, with potential sideways trading between $120 and $150.
- Investor Sentiment: Monitor key levels to gauge future price movements.
- Market Dynamics: Understand the balance between buyers and sellers to predict price trends.
