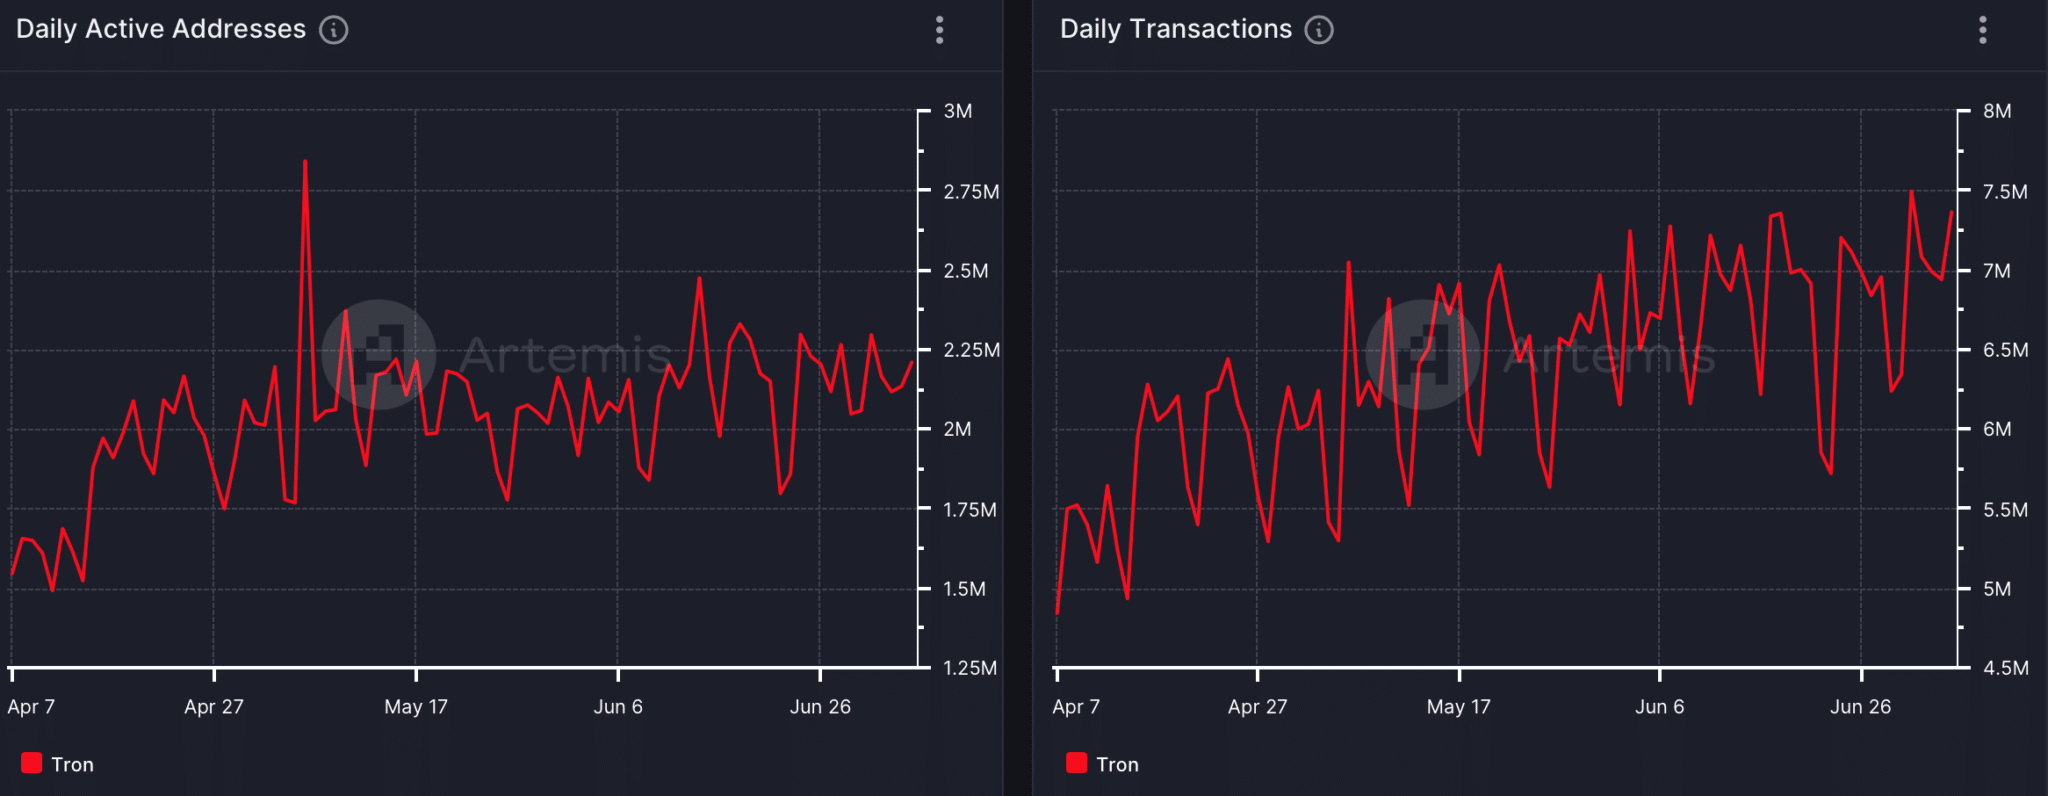
Tron (TRX) has experienced notable growth over the past month, with daily transactions increasing by 6% and the TRX price rising by 13%. This article explores the factors driving Tron’s recent performance and its potential future trajectory.
Points
- Tron network’s daily transactions increased by 6%.
- TRX price surged by over 13% in the last 30 days.
- Key market indicators show mixed signals, suggesting potential volatility.
- Enhanced usage and engagement across the Tron platform.
- Bullish outlook despite recent fluctuations in key financial metrics.
Over the past month, the Tron network has demonstrated impressive growth in both transaction activity and the price of its native cryptocurrency, TRX. The average daily transactions on the Tron network increased by 6% compared to the previous month, signaling enhanced usage and engagement across its platform.
Highlight
Average daily transactions on #TRON over the last 30 days have been 6.84 million, a 6% increase compared to the previous 30-day period.
pic.twitter.com/7VQ1cDExIY
https://twitter.com/TRONSCAN_ORG/status/1809491085884084627
Market Indicators and TRX Price
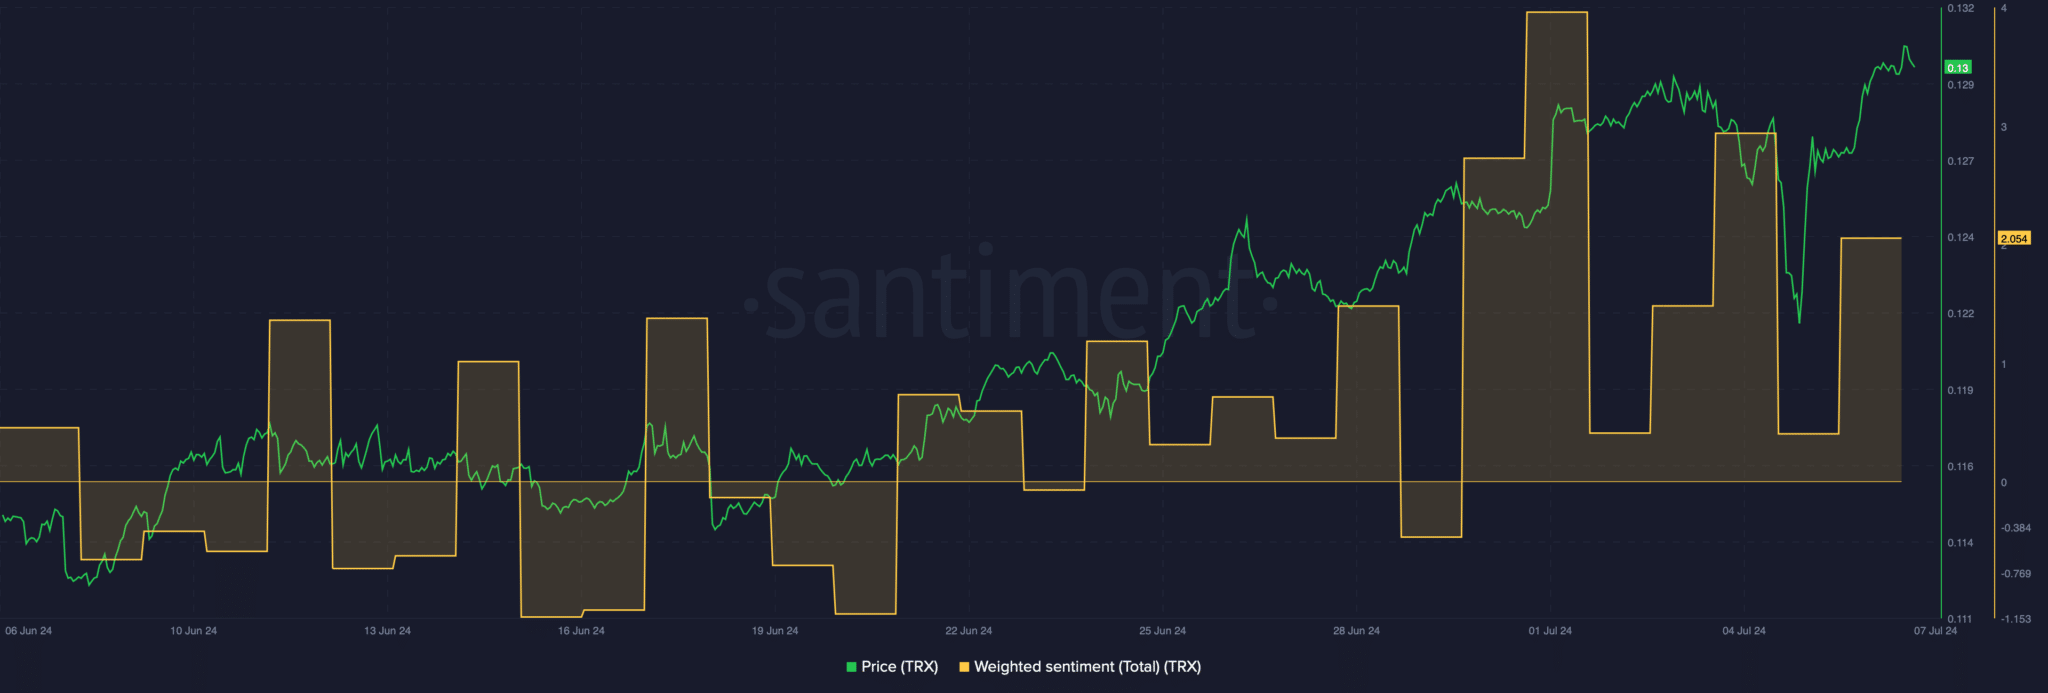
Regarding market indicators, TRX has shown substantial growth in the last month, currently trading at $0.1297 with a market capitalization of more than $11.3 billion. The Relative Strength Index (RSI), a measure of market momentum, has recently decreased, indicating potential upcoming price corrections. Conversely, the Moving Average Convergence Divergence (MACD), another key indicator, presents a bullish outlook, suggesting potential continued growth.

Source: Artemis

Source: Santiment
While Tron continues to expand its transaction capacity and attract market capitalization, fluctuations in key financial metrics and performance in the DeFi market will be crucial to watch for stakeholders and potential investors, considering the mixed signals from various market indicators.

Source: Coinglass
Looking Ahead
As Tron continues to demonstrate robust growth, its enhanced usage and increasing transaction volumes reflect growing confidence among investors and users. The network’s ability to maintain this momentum and address any emerging challenges will be key to sustaining its upward trajectory. Market participants should keep an eye on Tron’s performance in the DeFi space and other developments that could influence its future growth.
解説
- Relative Strength Index (RSI): A momentum indicator that measures the speed and change of price movements. An RSI above 70 is considered overbought, while an RSI below 30 is considered oversold.
- Moving Average Convergence Divergence (MACD): A trend-following momentum indicator that shows the relationship between two moving averages of a security’s price. It helps identify changes in the strength, direction, momentum, and duration of a trend in a stock’s price.
Tron’s recent performance showcases its potential as a leading cryptocurrency. The increase in daily transactions and the surge in TRX price highlight the network’s growing popularity and user engagement. However, investors should remain cautious of the mixed signals from market indicators, which suggest potential volatility. By closely monitoring Tron’s developments and performance in the DeFi space, stakeholders can make informed decisions about their investments in TRX. As the network continues to evolve, its ability to adapt and innovate will be crucial in maintaining its competitive edge in the ever-changing cryptocurrency landscape.
