
Litecoin (LTC) is showing signs of a potential price rebound driven by significant whale activity and bullish technical indicators.
Points
- Litecoin processes an average of $2.85 billion in large transactions daily, indicating strong whale activity.
- Technical indicators like MACD and RSI suggest mild bullishness.
- Key support and resistance levels are crucial for assessing price movements.
Whale Activity Analysis
According to a report by IntotheBlock, Litecoin processes an average of $2.85 billion in transactions over $100,000 daily, accounting for over 50% of its market cap. This level of whale activity is more than most Layer 1 cryptocurrencies and signals significant market interest.
Technical Indicators
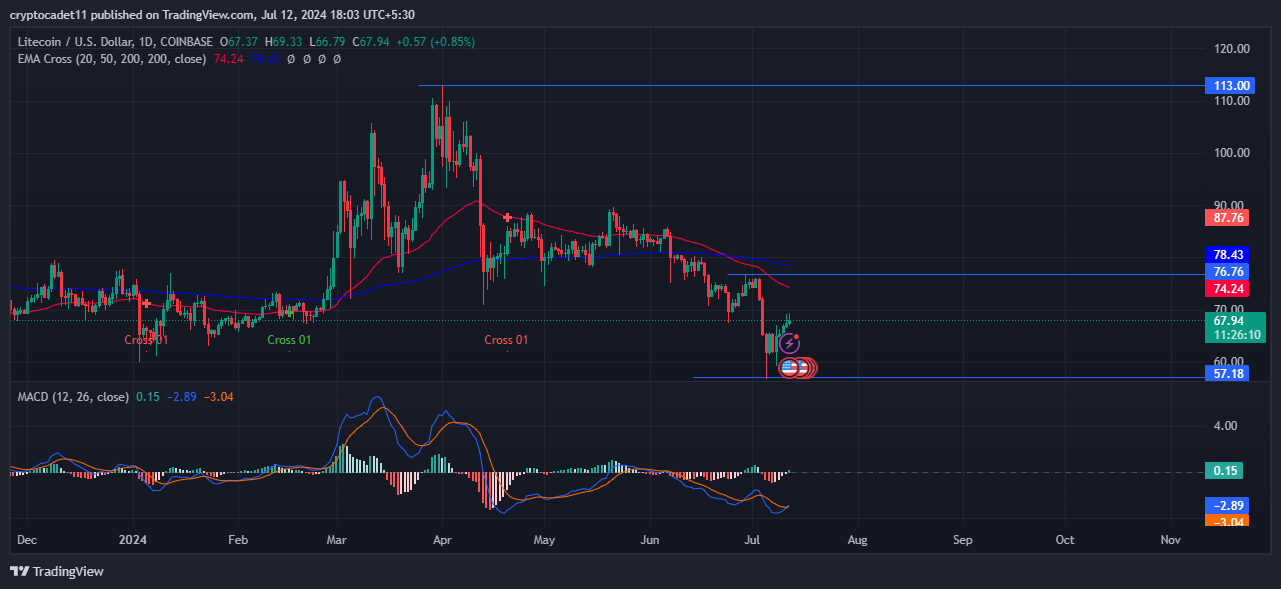
The daily technical chart for Litecoin shows a rebound from the $57.18 support level, indicating mild bullishness. Despite a 20.54% decline over the past three months, recent indicators such as the MACD and RSI are showing signs of recovery. The MACD curve is forming a bullish cross and moving upward, while the RSI curve has bounced back from the oversold zone, trading above the 14-day SMA line.
Key Levels to Watch
Despite recent bullish indicators, the overall technical summary suggests mixed sentiments. Out of 26 indicators, 11 are on the sell side, 10 are neutral, and 5 are on the buy side. Litecoin’s price currently trades at $68.37, with an intraday gain of 1.47%. Key resistance levels to watch are around $70 and $75, while support levels are at $60 and $55.
Conclusion
Litecoin is showing signs of a potential rebound, driven by significant whale activity and mild bullish indicators. Traders should closely monitor key support and resistance levels to gauge future price movements.
解説
- Whale Activity: The significant whale activity in Litecoin indicates strong market interest and potential for price movements. Large transactions often signal institutional involvement, which can drive price increases.
- Technical Indicators: Understanding technical indicators such as MACD and RSI helps in predicting price trends. The current bullish signals suggest a possible rebound, but traders should remain cautious due to mixed overall sentiments.
- Market Strategy: Traders should consider setting stop-loss orders and monitoring key levels to manage risks effectively. Keeping an eye on whale activity and technical indicators will be crucial for making informed trading decisions.