
Litecoin is showing signs of a potential price rebound, driven by significant whale activity and mild bullish indicators like MACD and RSI. However, the overall technical analysis remains mixed.
Points
- Litecoin processes an average of $2.85 billion in transactions over $100k daily, more than most Layer 1 cryptocurrencies.
- Recent whale activity indicates a potential bullish reversal.
- Indicators like MACD and RSI show mild bullish signs.
- Despite recent gains, the overall technical summary suggests mixed signals.
Litecoin Price Prediction: LTC Suggesting Bullish Reversal
Litecoin (LTC) has recently shown signs of potential recovery. According to a report by IntotheBlock, Litecoin processes an average of $2.85 billion in transactions over $100k daily, which accounts for over 50% of its market cap. This transaction volume is more than most Layer 1 cryptocurrencies, indicating strong underlying activity.
On the daily technical chart, Litecoin is bouncing back by taking support at $57.18, showcasing mild bullishness in the last few trading sessions. The price of LTC began to decline in early April, dropping from $113.00 and continuing a downtrend by breaking below key exponential moving averages.
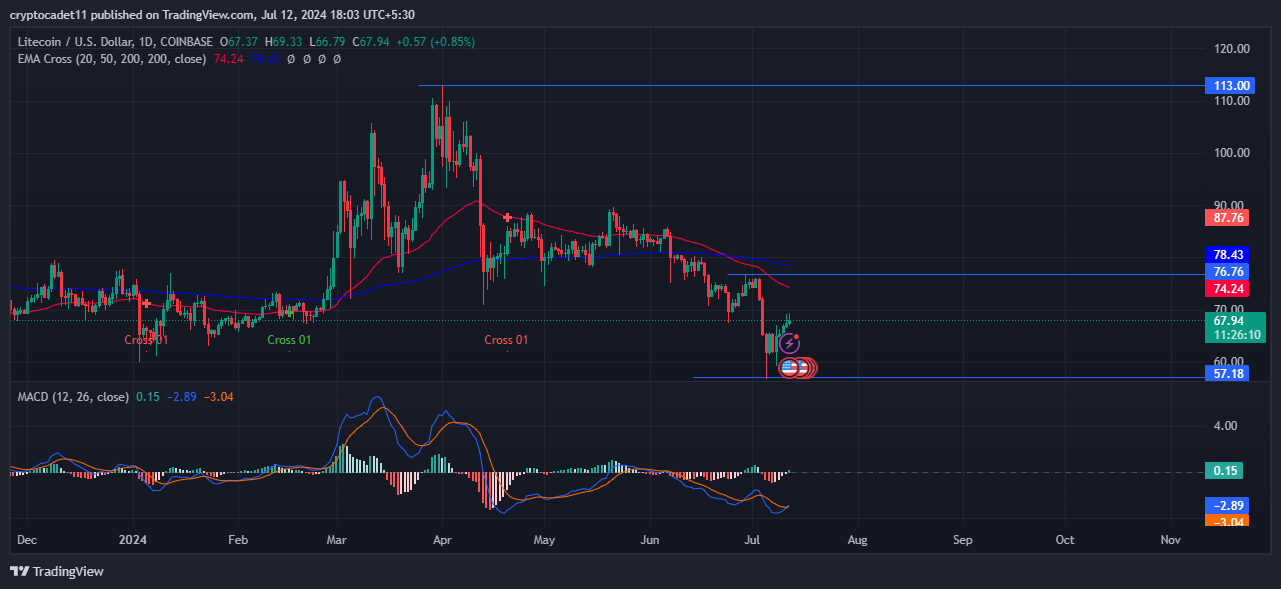
The performance of the coin has been weak in the last few months as the price went down by 20.54% in the last three months and down by 11.44% in the last month. However, last week it increased by 4.66%, showing buyers’ presence in the coin.
Moreover, indicators like MACD and RSI are also showing mild bullish signs. The MACD curve is in the bearish zone but forms a bullish cross and heads in an upward direction. The RSI curve bounced back from the oversold zone and headed in the upward direction trading above the 14-day SMA line showcasing bullishness.
However, according to the technical summary of Tradingview, out of 26 indicators, 11 are on the sell side, 10 are on the neutral side, and 5 are on the buying side, suggesting bearishness in the chart.
At the time of writing, Litecoin’s price was trading at $68.37 with an intraday gain of 1.47%, showcasing bullishness on the technical chart. The 24-hour trading volume was $311.04 million, and its market cap stands at $5.12 billion.
Conclusion
Litecoin is showing signs of a potential rebound, driven by significant whale activity and mild bullish indicators like MACD and RSI. While recent price movements suggest a possible upward trend, the overall technical analysis remains mixed. If Litecoin can surpass key exponential moving averages, it may initiate a bullish rally; otherwise, it could continue its bearish momentum.
解説
- Whale Activity: The increase in whale activity typically indicates that large holders are accumulating, which can lead to significant price movements. This is a positive sign for Litecoin.
- Technical Indicators: MACD and RSI are showing signs of bullishness. A bullish cross in MACD suggests a potential upward movement, while the RSI moving above the 14-day SMA line indicates increased buying pressure.
- Mixed Signals: Despite the positive indicators, the overall technical summary remains mixed, with many indicators still suggesting bearishness. This indicates caution in the market, and a clear trend has yet to be established.