Analyze Solana’s (SOL) recent price movements and predictions for the near future, considering market conditions and technical indicators.
Points
- Recent Price Decline: SOL’s price has declined slightly over the last 24 hours.
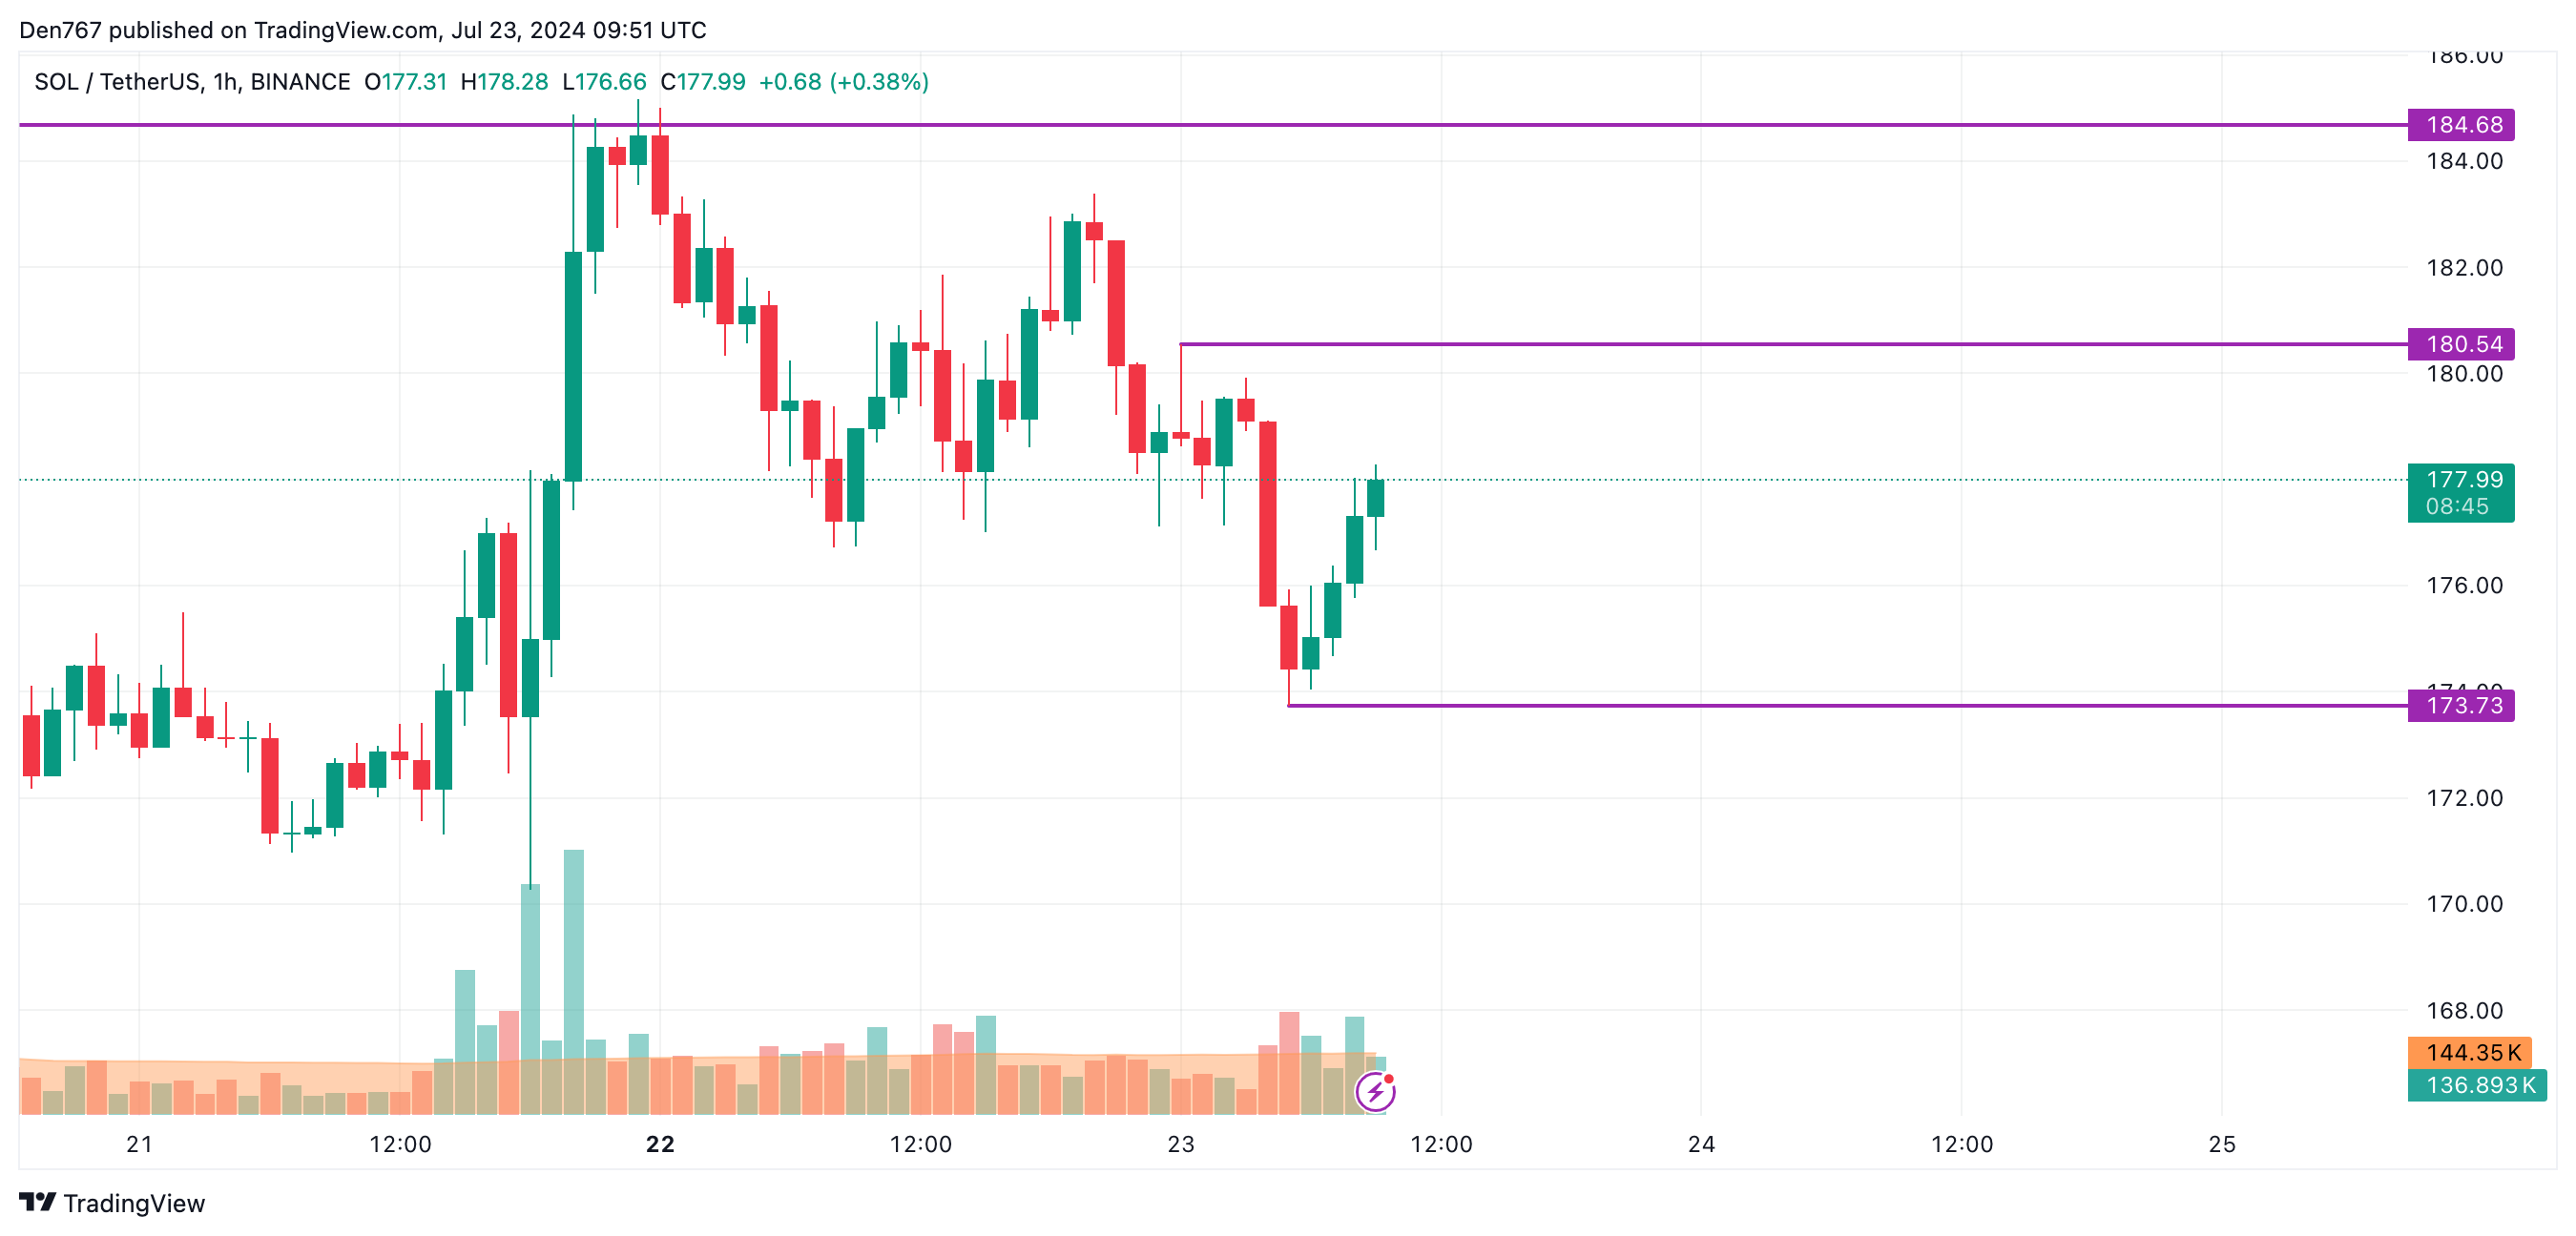
- Local Support Level: Possible support at $173.73.
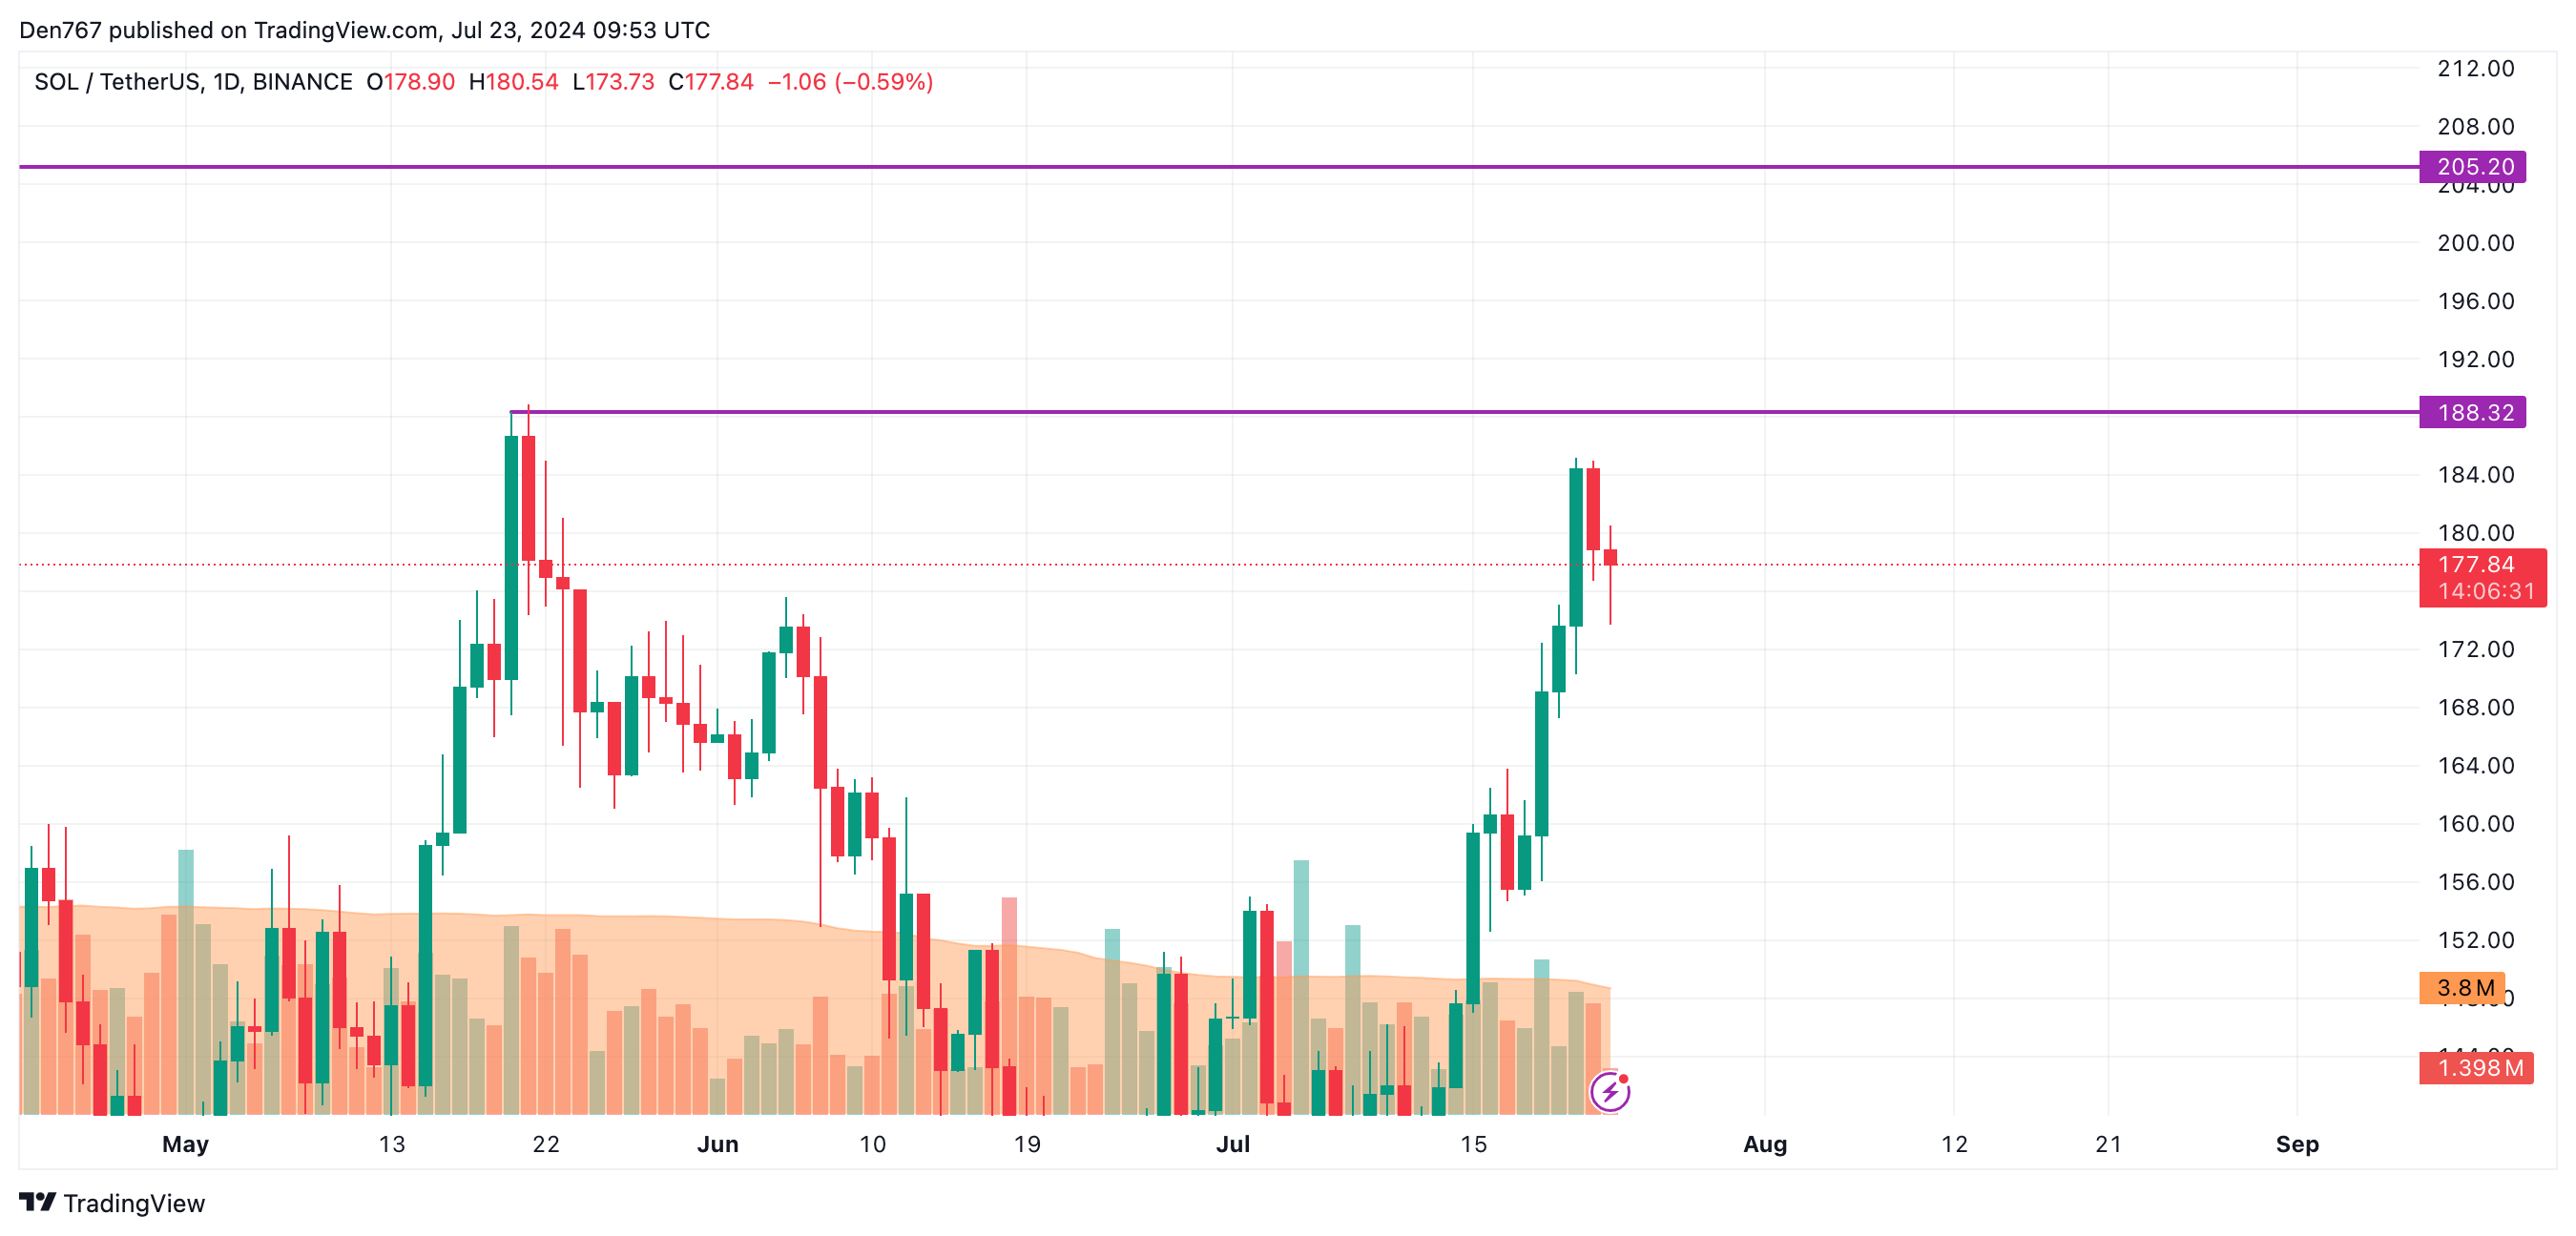
- Resistance Levels: Key resistance at $180 and $188.32.
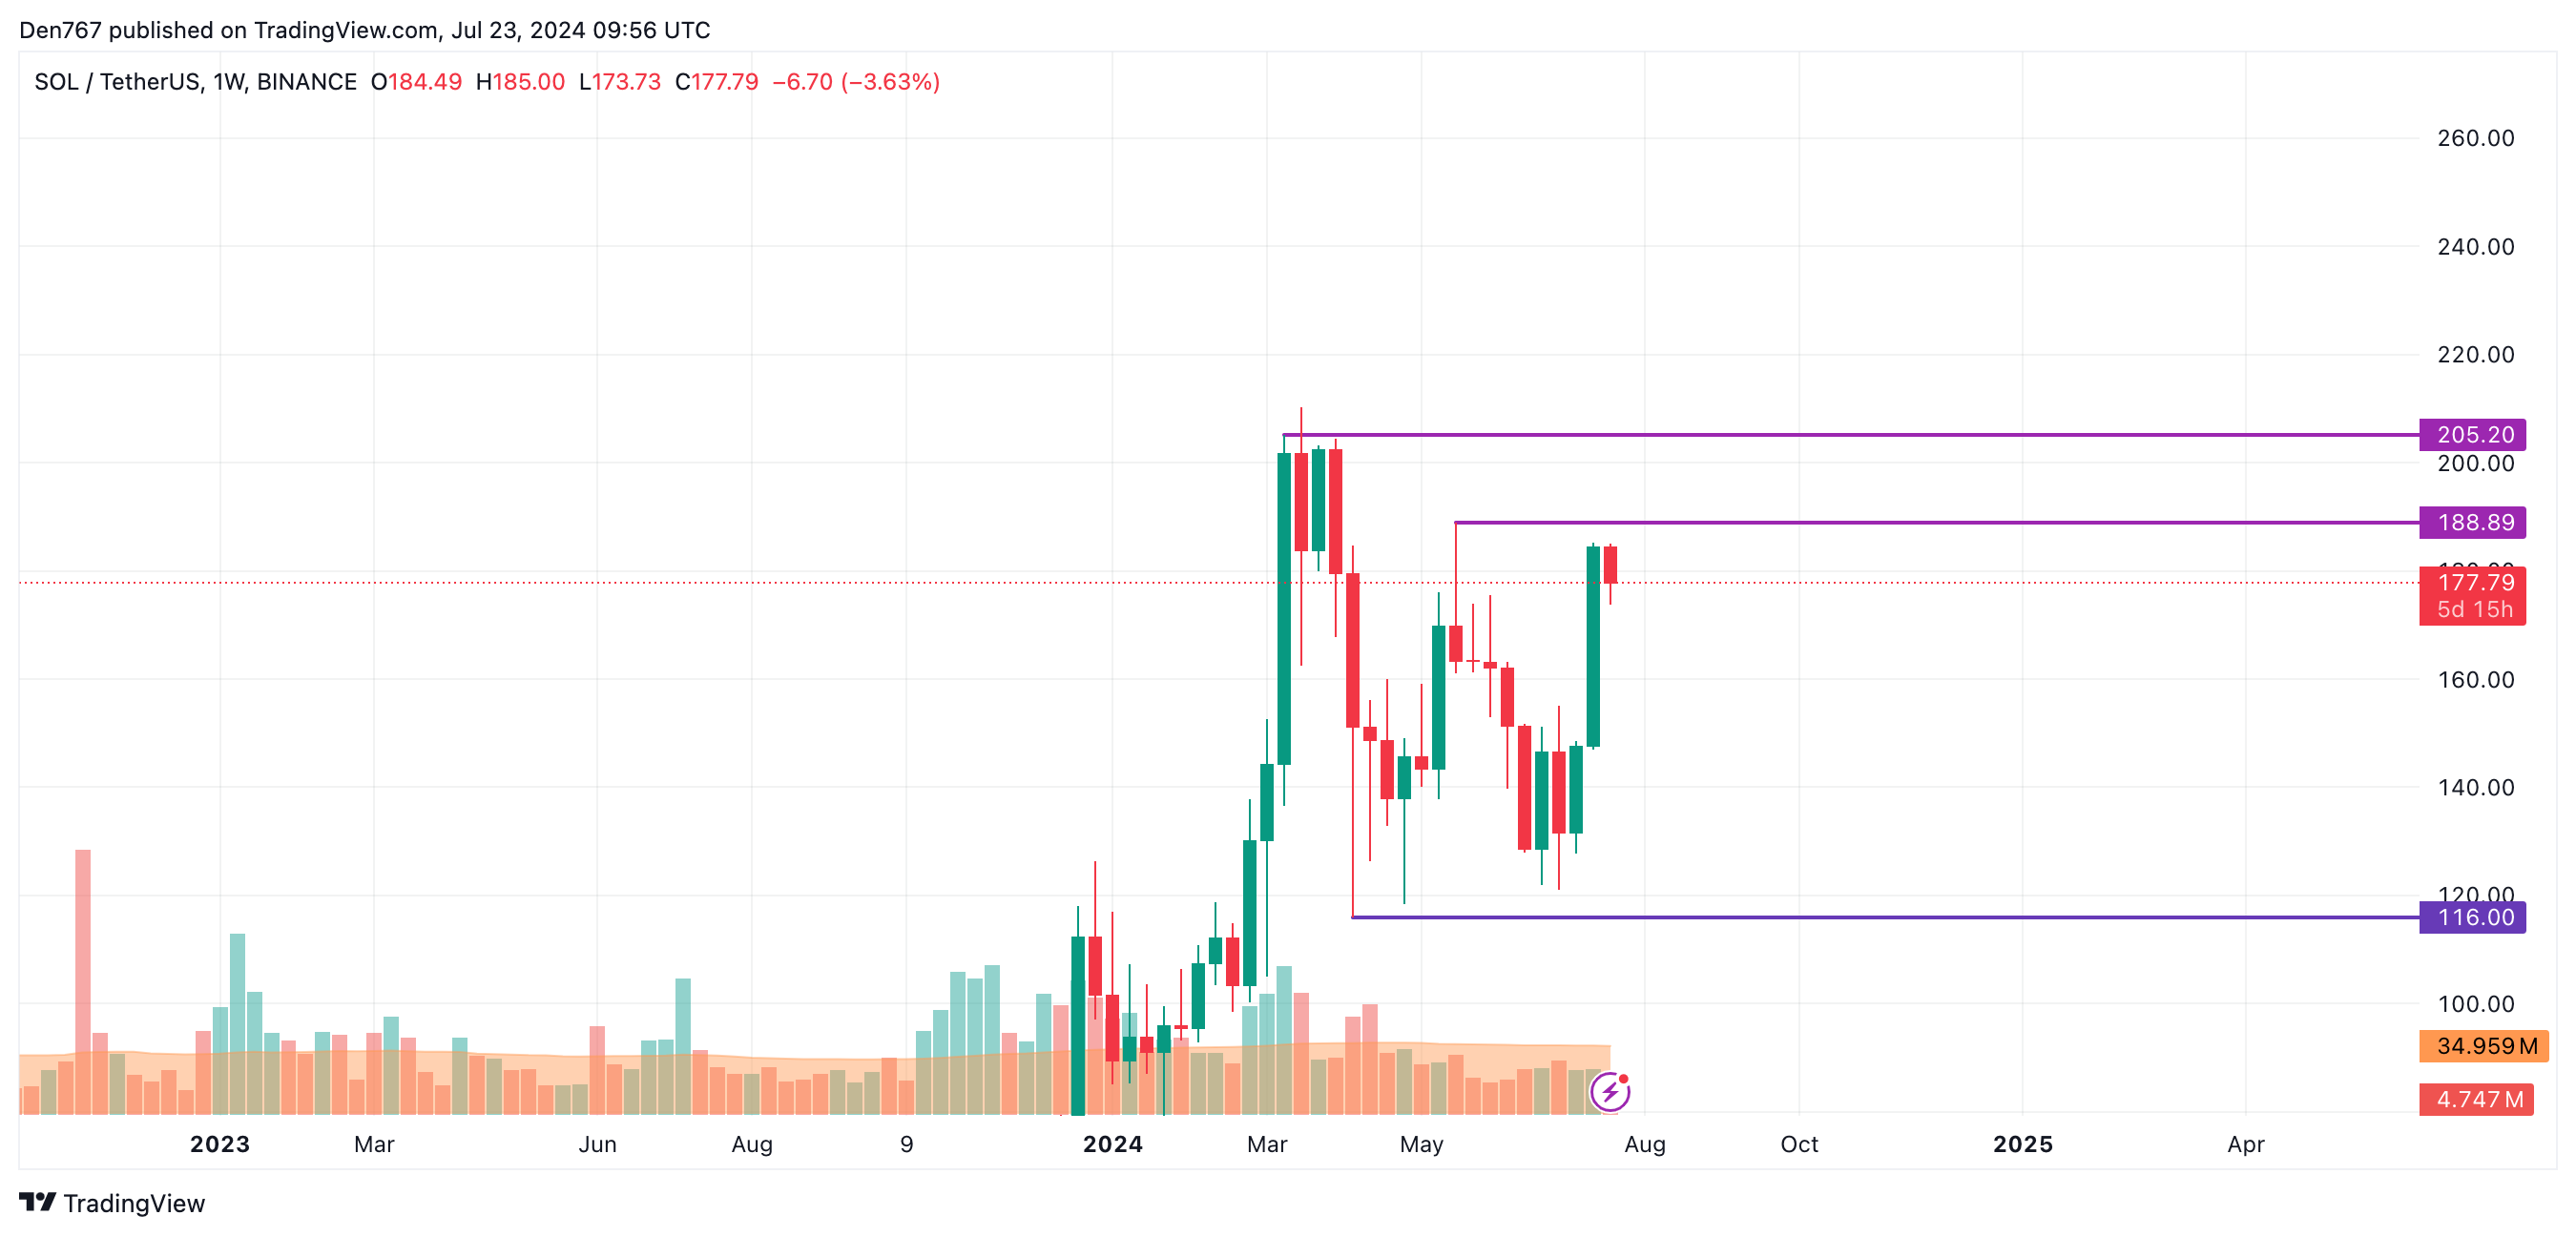
- Midterm Outlook: Weekly bar’s closure above $188.89 could lead to further growth.
The price of Solana (SOL) has experienced a slight decline of 0.26% over the last 24 hours. Despite this minor drop, the technical analysis suggests potential support and resistance levels that could influence future price movements.
SOL/USD
On the hourly chart, SOL appears to have found local support at $173.73. If the daily bar closes near $180, there is potential for growth, leading to a test of the $182-$184 zone shortly.

On a larger time frame, sellers currently control the market. Buyers may start considering a reversal only if they can return the rate to the resistance level of $188
.32 and secure a position above it.

From a midterm perspective, attention should be focused on the weekly bar’s closure in relation to the $188.89 level. If SOL can break out above this level, it could pave the way for further growth, potentially reaching the vital area of $200.

Currently, SOL is trading at $177.79.
解説
- Local Support and Resistance: SOL has shown a potential support level at $173.73, with resistance levels at $180 and $188.32. Breaking through these resistance levels could lead to significant price increases.
- Market Control: Sellers dominate the market, but a reversal could occur if buyers regain control at key resistance levels.
- Weekly Bar Analysis: The weekly bar’s closure is critical, with $188.89 being a key level for future growth. Breaking this level could see SOL aiming for the $200 mark.
- Technical Indicators: Monitoring technical indicators like support and resistance levels can provide valuable insights into potential price movements for SOL.
