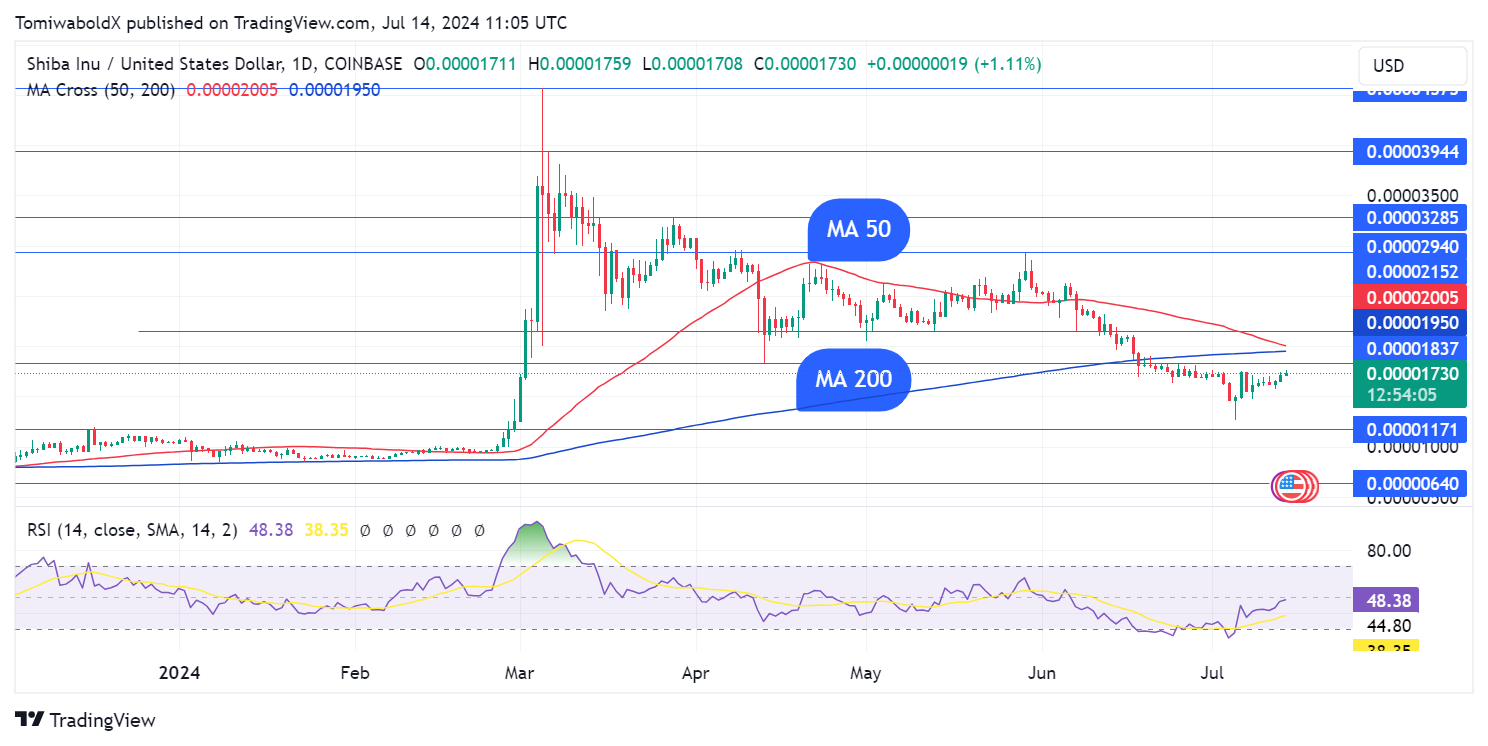
Shiba Inu (SHIB) is on the verge of revealing a rare pattern in 2024, which could significantly impact its price movement. The article discusses the potential implications of this pattern.
Points
- SHIB’s price is closely watching the convergence of the daily SMA 50 and SMA 200.
- The pattern could be a golden cross or a death cross, each indicating different market directions.
- SHIB’s recent price movements suggest an impending significant change.
Shiba Inu (SHIB) is approaching a rare and potentially impactful pattern formation in 2024. As the daily SMA 50 and SMA 200 converge, traders are closely monitoring the potential crossover, which could either be a golden cross or a death cross.
 SHIB/USD Daily Chart, Courtesy: TradingView
A golden cross, where the 50-day SMA crosses above the 200-day SMA, is typically a bullish signal suggesting a potential upward trend. Conversely, a death cross, where the 50-day SMA crosses below the 200-day SMA, indicates a possible downtrend. As SHIB nears this pattern formation, all eyes are on its price to determine the next direction.
At the time of writing, SHIB has increased by 2.35% in the last 24 hours, trading at $0.00001744, and up 6.35% weekly. This recent price movement adds to the anticipation surrounding the potential crossover and its implications for SHIB’s future.
解説
- Golden Cross: A bullish pattern indicating a potential upward trend when the 50-day SMA crosses above the 200-day SMA.
- Death Cross: A bearish pattern suggesting a possible downtrend when the 50-day SMA crosses below the 200-day SMA.
- Market Impact: The formation of either pattern could significantly impact SHIB’s price movement, influencing trader sentiment and market dynamics.
- Current Price Movement: SHIB’s recent increase in price and trading activity reflects growing investor interest as the pattern formation approaches.
