 Prediction for July 30")
A detailed analysis of Binance Coin (BNB) price movements, highlighting recent trends, support and resistance levels, and future predictions based on technical analysis.
Points
- BNB price has dropped by 2.62% over the last day.
- Testing local resistance at $576.40.
- Sideways trading between $560-$590 is expected.
- Midterm outlook shows ongoing consolidation.
BNB/USD Price Analysis
The rate of Binance Coin (BNB) has dropped by 2.62% over the last day, with the current trading price at $574.40. On the hourly chart, BNB is showing bullish signs as it approaches the local resistance level of $576.40. If the price closes near this level, there is potential for a breakout, followed by a move towards the $580 zone.
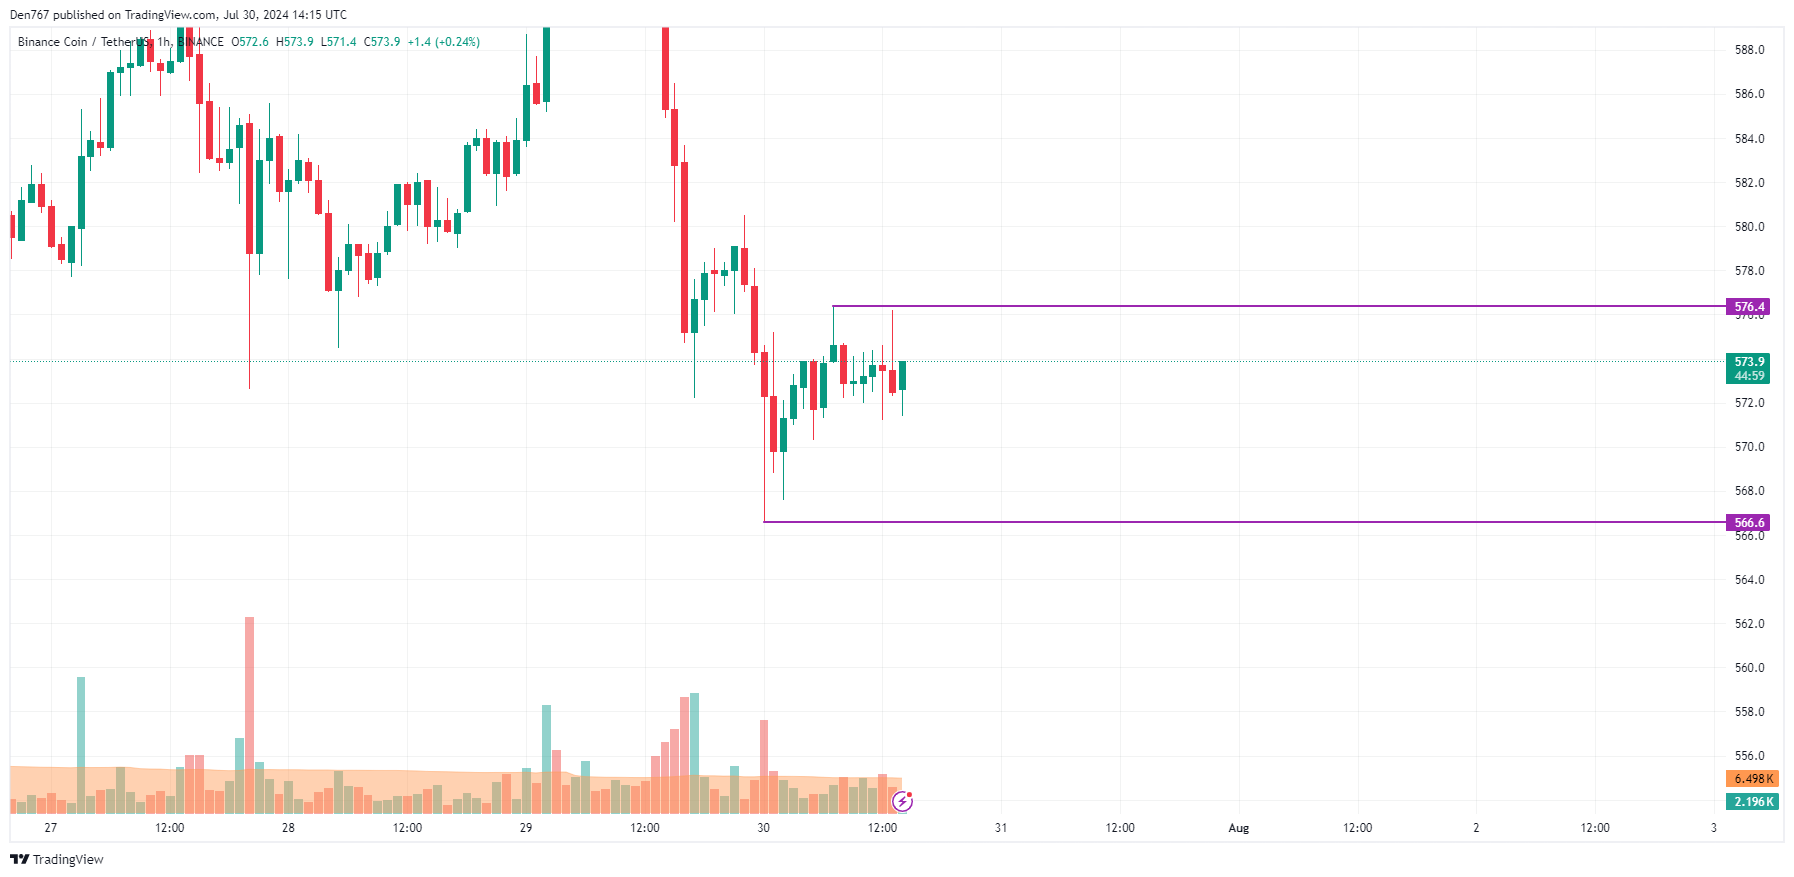 Image by TradingView
Short-Term Outlook
On a larger time frame, BNB’s price remains far from both support and resistance levels, indicating that neither side is ready for a sharp move. This sentiment is confirmed by low trading volume. Consequently, sideways trading within the wide range of $560-$590 is the most likely scenario in the near term.
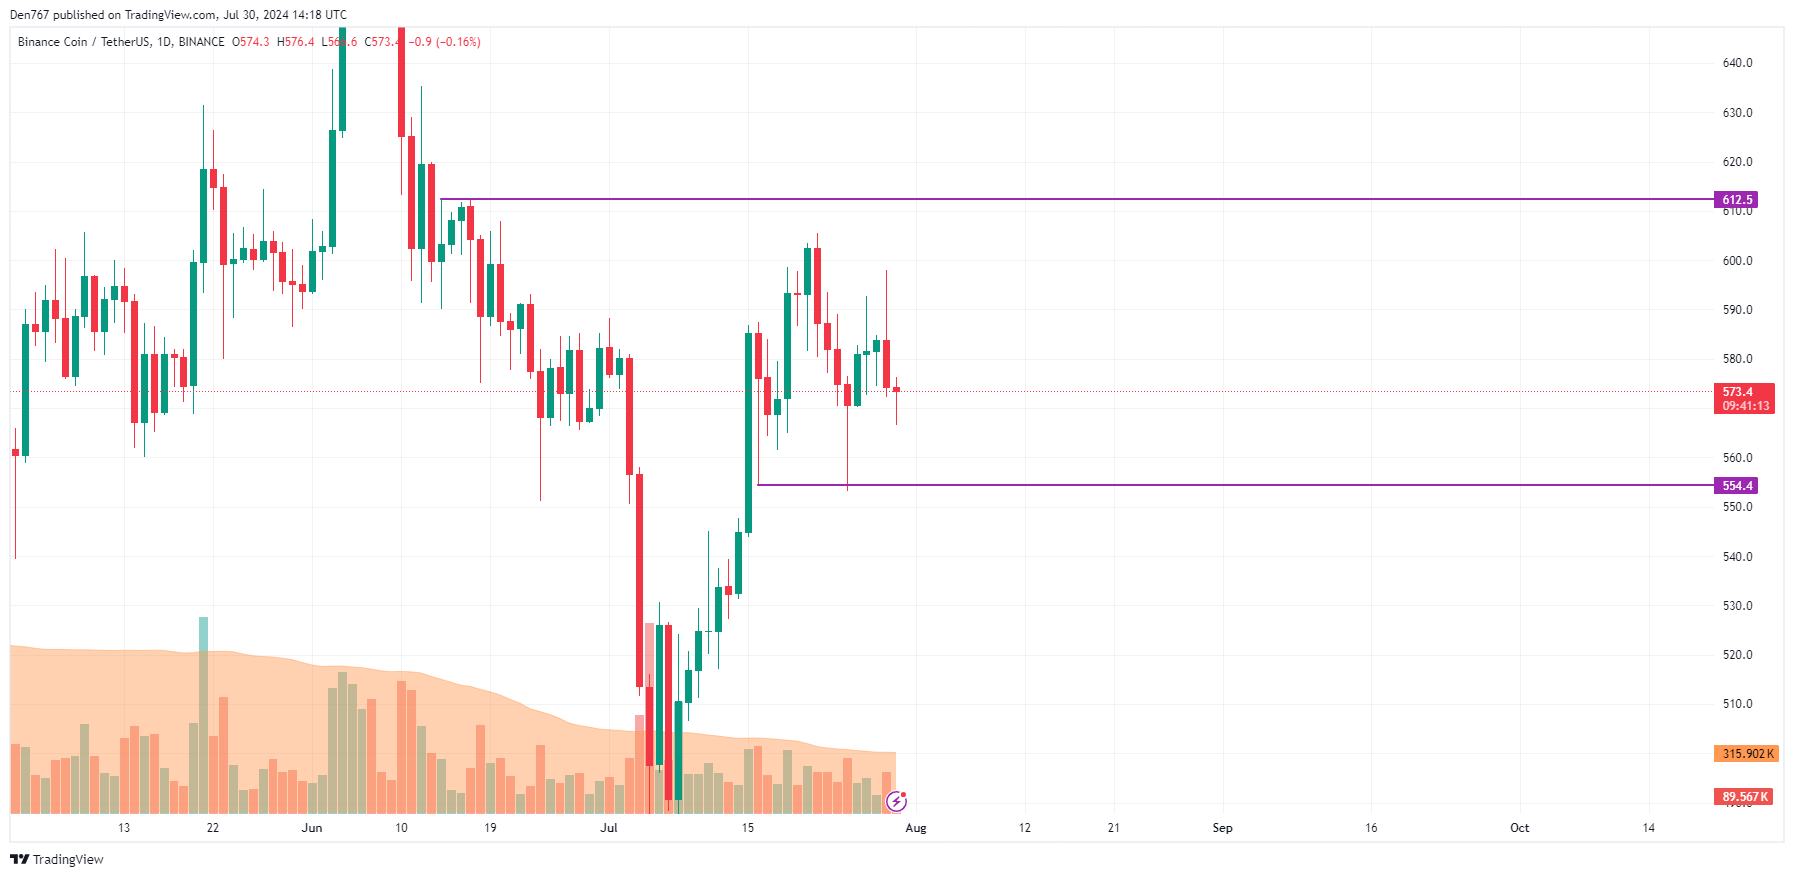 Image by TradingView
Midterm Outlook
From a midterm perspective, the picture remains similar. If the weekly candle closes around current prices, traders may witness ongoing consolidation between $550 and $600. The current trading environment suggests that significant moves are unlikely without increased trading volume.
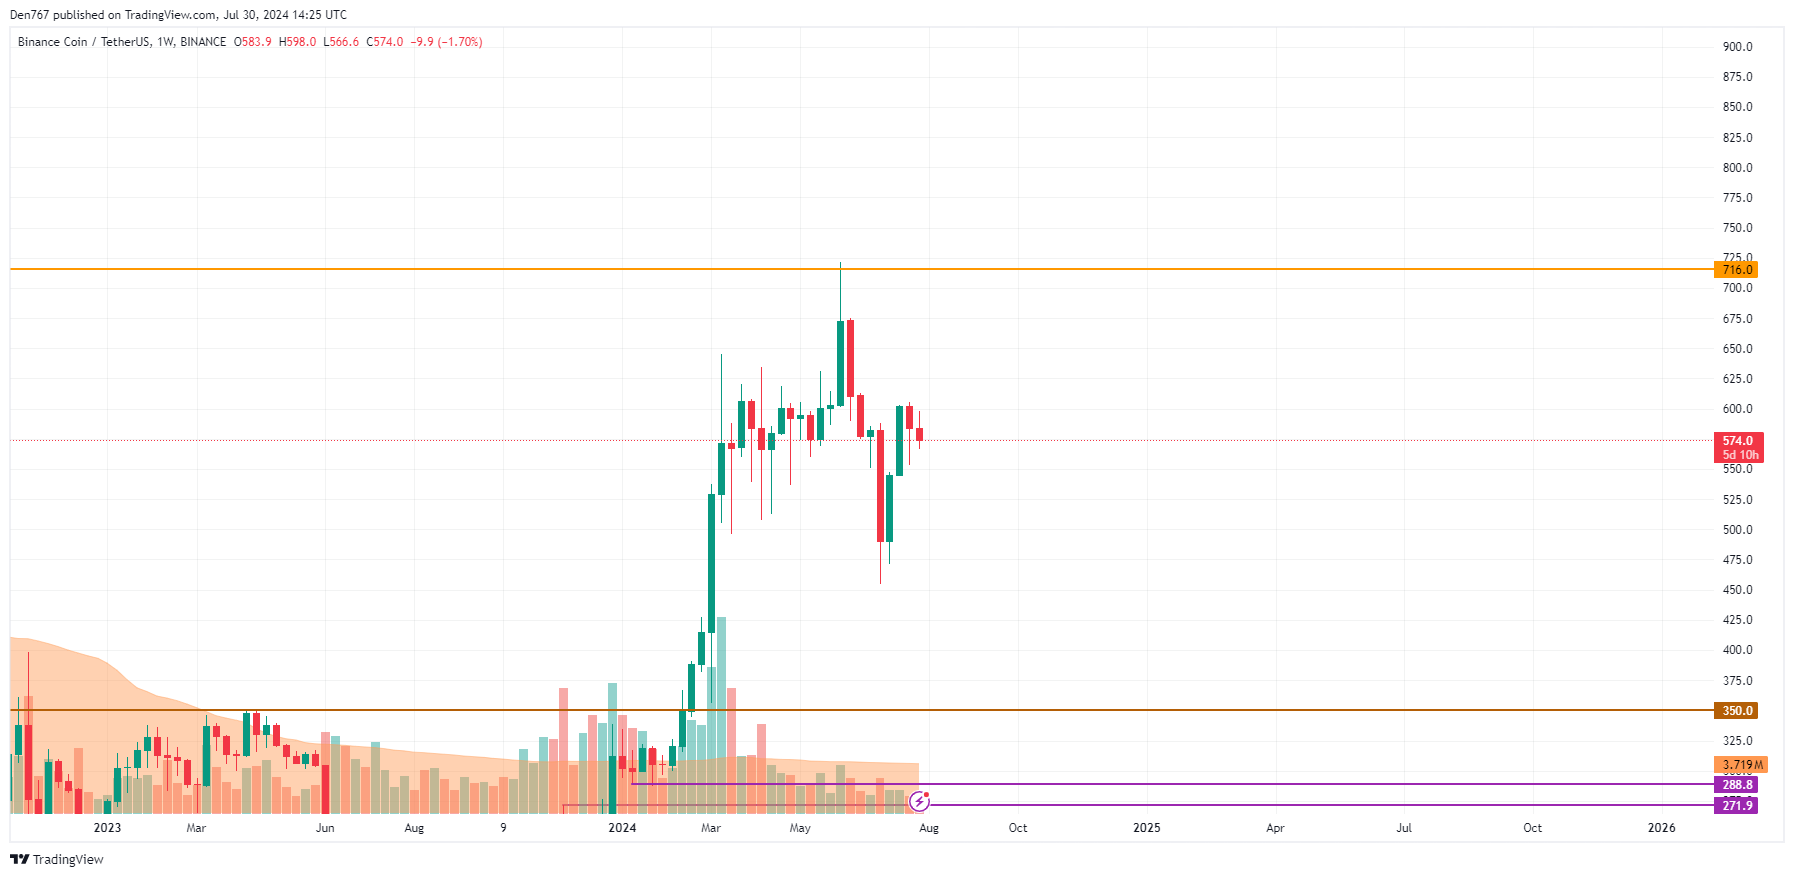 Image by TradingView
解説
- Support and Resistance: Understanding the critical levels of $576.40 for resistance and $560 for support is essential for predicting BNB’s short-term movements.
- Volume Analysis: Low trading volume supports the expectation of sideways trading, indicating a lack of strong buying or selling pressure.
- Market Sentiment: The midterm consolidation suggests a neutral market sentiment, with no significant catalysts for price movement currently identified.
- Technical Indicators: Using technical indicators like moving averages and volume analysis can help traders identify potential breakout or breakdown scenarios.