This article provides a comprehensive analysis and price prediction for Shiba Inu (SHIB) in 2024, based on current market status, technical indicators, and comparisons with major cryptocurrencies like Bitcoin (BTC) and Ethereum (ETH).
Points
- Overview of Shiba Inu (SHIB)’s current market status.
- Technical analysis and price prediction for 2024.
- Key support and resistance levels.
- Comparisons with Bitcoin (BTC) and Ethereum (ETH).
Shiba Inu (SHIB) has been making waves in the cryptocurrency market, gaining a significant following and ranking 13th on CoinMarketCap by market capitalization. This article provides an in-depth analysis of SHIB’s current market status and offers a price prediction for 2024 based on various technical indicators and market comparisons.

Current Market Status: As of now, Shiba Inu (SHIB) is priced at $0.00001677. The cryptocurrency has shown a strong upward trend, forming an ascending triangle pattern, which is typically indicative of a bullish market. This pattern is characterized by a horizontal upper trendline connecting the highs and a rising lower trendline connecting the lows.
Price Prediction for 2024: If the current bullish trend continues and SHIB breaks out at the resistance level, we could see the price rise to $0.00002043 or even $0.00003137. However, if the trend reverses, the price might fall to the support levels of $0.00001601 and $0.00001270. The key resistance and support levels for SHIB in 2024 are as follows:
- Resistance Level 1: $0.00002944
- Resistance Level 2: $0.00004981
- Support Level 1: $0.00001531
- Support Level 2: $0.00000833
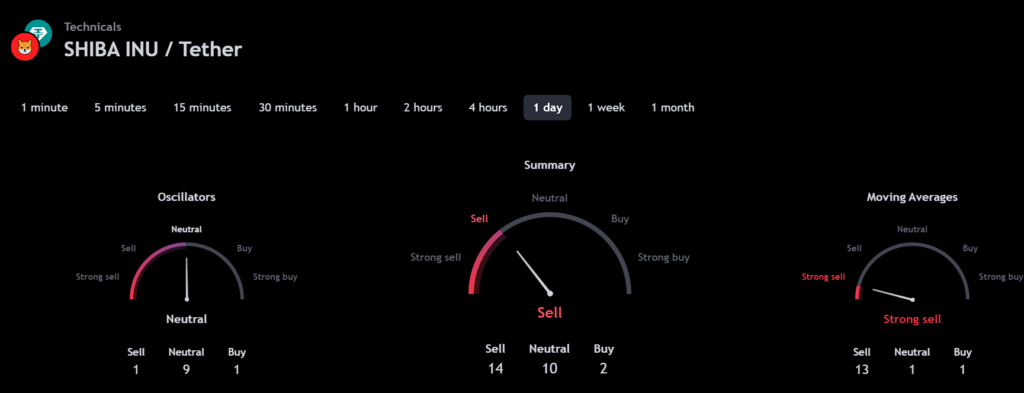
Technical Indicators: Several technical indicators provide insights into SHIB’s price prediction for 2024. The 50-day Moving Average (50MA) indicates a bearish trend as the price is below the 50MA. The Relative Strength Index (RSI) is nearly oversold, suggesting potential upward momentum. Additionally, the Relative Volume (RVOL) is below the cutoff line, indicating weak trading volume.
- 50-Day Moving Average (50MA): $0.00001827 (Bearish/Downtrend)
- Relative Strength Index (RSI): 47.39 (Nearly Oversold)
- Relative Volume (RVOL): Below cutoff line (Weak volume)
Comparison with BTC and ETH: Comparing SHIB with major cryptocurrencies like Bitcoin (BTC) and Ethereum (ETH), we observe that SHIB’s price action often mirrors that of BTC and ETH. When BTC and ETH rise or fall, SHIB tends to follow suit. This correlation suggests that broader market trends will significantly influence SHIB’s price movement.
Price Prediction Beyond 2024: Looking further ahead, if SHIB continues to establish itself as a significant player in the crypto market, it could reach $0.0001. Further advancements and upgrades within the Shiba Inu ecosystem might even push SHIB to surpass its all-time high (ATH) of $0.00008845.
In conclusion, Shiba Inu (SHIB) shows potential for significant price movements in 2024, driven by technical indicators and market trends. Investors should monitor key support and resistance levels and broader market conditions to make informed decisions.
解説
- Ascending Triangle Pattern: A bullish chart pattern formed by a horizontal upper trendline and a rising lower trendline, indicating a potential upward breakout.
- 50-Day Moving Average (50MA): An indicator that shows the average price of an asset over the past 50 days, used to identify trends.
- Relative Strength Index (RSI): A momentum oscillator that measures the speed and change of price movements, used to identify overbought or oversold conditions.
- Relative Volume (RVOL): A measure of the current trading volume compared to the average volume over a specific period, indicating the strength of a trend.
